🚨The Statistical Edge: Mechanical Bullish Setups🚨
I’m going live at 4 PM ET to reveal a widespread statistical phenomenon discovered using a standard bell curve. Join me to see exactly how I use a simple, completely mechanical “start… stop…” dashboard to identify top-tier, emotion-free bullish opportunities ripe for the taking this week [Click here to book your seat]
I’ve been watching 0DTE options closely lately, and there’s a pattern that keeps showing up like clockwork.
If you’ve been trading these short-dated contracts, you’ve probably felt it yourself — something about the morning just feels expensive.
Here’s what I’m seeing: Call option premiums on 0DTE trades are significantly inflated in the morning hours.
I’m talking about really rich premiums that are heavily tilted toward the expensive side, especially for calls. I haven’t dug as deeply into put options, but the call side is clear as day.
Part of why this stands out to me is because I look at the whole market through a kind of scorecard method. I blend together directional indicators, volatility expectations and structural setups to get a general sense of what the market should be doing.
On Thursday, my backdrop pointed to a market expected to drift higher by about 50 basis points. That context matters because when you have a mild upward bias, navigating the opening bell’s unique volatility structure requires absolute precision.
Let me give you a concrete example from Thursday’s opening session. Right after the bell, I was looking at an S&P 500 (SPY) $747-$748 call debit spread.
With SPY crossing the opening print at $747.40, the pricing on that $1-wide spread was sitting right around $0.40-$0.50.
It was an aggressive entry, but the risk-to-reward was clear if the market followed the early script.
The Premium Decay Pattern vs. the Opening Spike
Here’s where it gets interesting.
I estimated that if the market pushed through the strikes, you could sell that same spread for $0.75 within the morning window. And sure enough, as the opening momentum surged, the spread moved to $0.7502 shortly after.
Think about that for a second. You’re looking at a spread that costs $0.50 in the morning and hits $0.75 shortly after. That’s a 50% move.
On a typical day, a chunk of that expansion can come from morning implied volatility (IV) normalizing as the day progresses. But on Thursday, it was a hyper-fast lesson in delta and intrinsic value.
Within the first 40 minutes of trading, SPY aggressively ripped upward to an early peak of $751.31. Because that directional pop shoved the $747-$748 spread completely in the money (ITM), the spread rapidly expanded toward its maximum $1.00 mathematical ceiling, hitting our $0.75 target on the nose.
There’s a subtle structural element that helps explain why managing this timing is so critical.
The market has statistical rhythms — certain days and certain periods of the year tend to behave in predictable ways, and those tendencies influence how options are priced.
Usually, market makers price in massive uncertainty at the open by inflating the variance risk premium. As the session unfolds, that risk premium bleeds off.
On Thursday, that bleed happened fast — and it was accompanied by a total afternoon reversal that sent SPY sliding back down to close at $744.78.
What This Means for Your Trading
This price action highlights exactly why understanding 0DTE premium behavior creates a real strategic edge.
If you’re buying call debit spreads on 0DTE options, you have to know exactly what kind of environment you’re stepping into.
On a slow, grinding day, patience pays — waiting an hour or two for the morning volatility to settle down often gives you a 20%-30% better entry.
But on a day like Thursday, it flips. When a morning burst pushes your strikes deep ITM, you can’t afford to sit on your hands and wait for “normalization.”
You have to take your 50% profit while the intrinsic value is capped out because 0DTE premiums wait for no one, and that morning window can slam shut fast.
On the flip side, if you’re selling premium through credit spreads, that afternoon collapse is exactly what you’re waiting for once the morning froth blows off.
It’s not about predicting some massive, permanent macro shift — it’s about understanding when the price you’re paying or collecting is fair versus inflated and tracking how fast that value moves.
That’s the edge. Simple, repeatable and grounded in how these contracts actually behave.
Talk soon,
JD
The Rational Trader
Follow along and join the conversation for real-time analysis, trade ideas, market insights and more!
- Telegram: https://t.me/jamie_dlugosch
- YouTube: https://www.youtube.com/@FiresideTrader
Important Note: No one from the ProsperityPub team or The Rational Trader will ever contact you directly on Telegram.
*This is for informational and educational purposes only. There is inherent risk in trading, so trade at your own risk.
P.S. Live at 4 PM ET: The Statistical Edge Handing Us Bullish Setups
In the current market environment, utilizing probability in your trading strategy is proving more beneficial than ever.
Generally speaking, trading effectively depends on the data, the numbers. So if you have a statistical edge against the market, double down on it.
If you don’t, then you’ll want to pay attention to one I discovered using the standard bell curve like the one below…
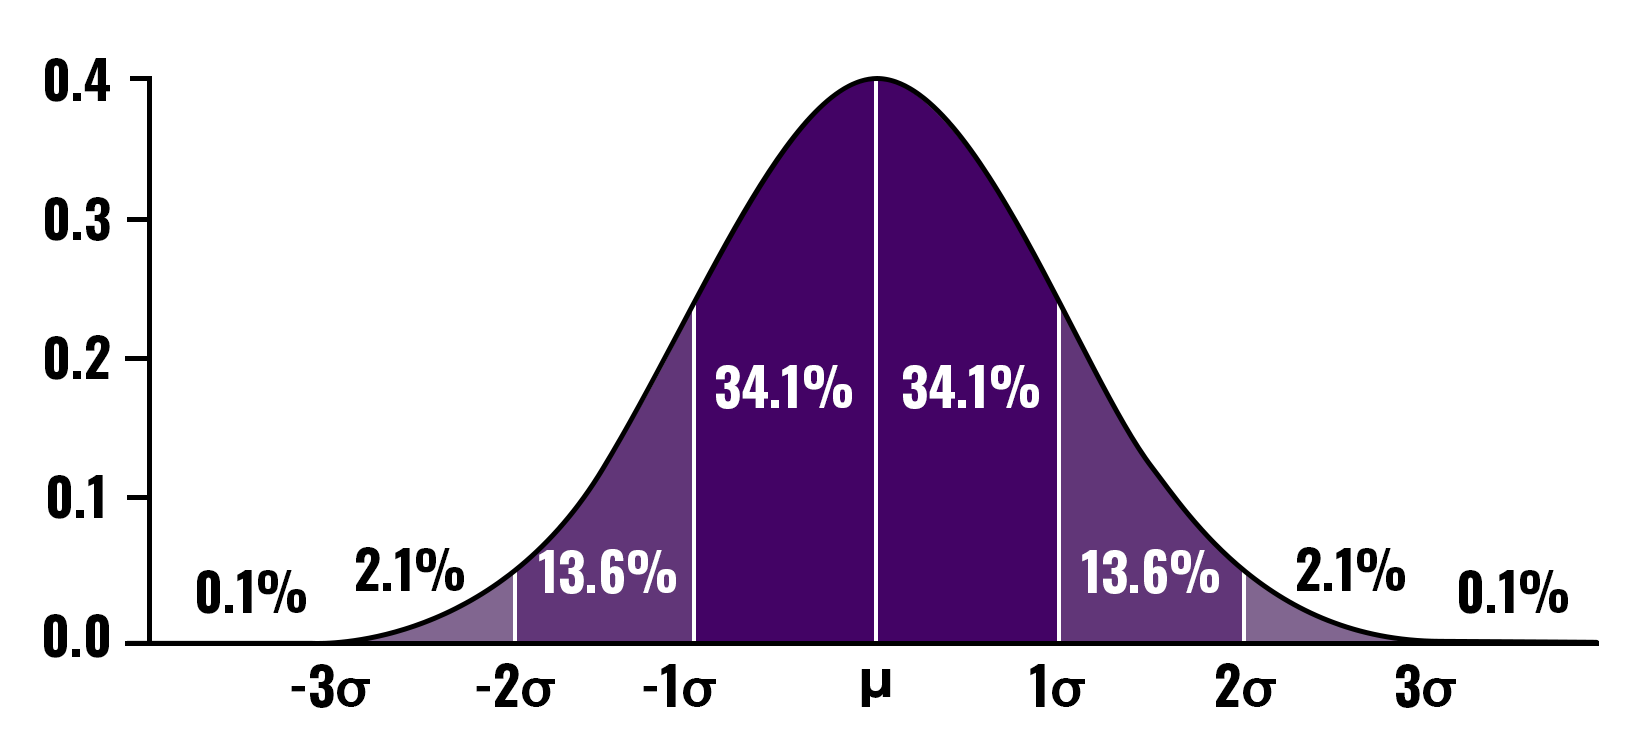
It’s one that allows me to go after only the top-tier opportunities on stocks you probably wouldn’t even think to trade.
And one that’s handing us the bulk of this week’s top opportunities.
Tune in at 4 p.m. ET as I reveal the details.

You’ll see exactly how I used a simple “start… stop…” dashboard that tells me when bullish moves are ripe for the taking.
All completely mechanical, with zero emotions involved.
Even better, the numbers are in our favor! Granted, I can’t make trading guarantees here…
But I can show you exactly how you can join me this week as I put this statistical advantage to work.
Want in?
Disclaimer: We develop tools and strategies to the best of our ability, but no one can guarantee the future. There is always a risk of loss when trading past performance is not indicative of future results. In live trades since Nov. 2025, the strategy has won 74% of the time with an average winner of 83.68% with an average hold time of 25 days.