There are certain patterns in the market that grab my attention more than others. And when we see a seven-day win streak where markets gain over 7%, that’s one of them.
This isn’t just about feeling good because we had a nice run. It’s about what the historical data tells us happens next. And if you’ve been following along with me here for a while, then you probably know that I love data and crunching numbers.
So what do the numbers say?
Historically, such momentum has led to markets being higher 85% of the time over the next one, three and six months, with an average six-month return of 14%.
Currently, momentum readings are significantly above average, with markets 60% higher over one month and 66% higher over three months. That puts us in the 90th percentile across multiple time frames, which makes this more than just another strong week — it’s a signal worth paying attention to.
The Numbers That Matter
When we see this kind of extreme momentum event, markets go higher 85% of the time over the next month. But it doesn’t stop there. Over the next three months, the odds remain 85%. And over the next six months, they’re still 85%.
That kind of consistency across multiple time frames is rare — and it’s the type of signal I want backing my positioning.
The average six-month return following this signal is 14%. If you got 14% in a year, you’d be pumped. This is suggesting that kind of return compressed into just six months. That’s why I don’t take this lightly.
Why This Signal Mattered for My Recent Positioning
This signal appeared during the week ending in mid-April, right as markets were recovering from that fear spike we all felt. It was one of the key data points that gave me confidence to stay positioned for higher prices even though my ideal entry levels weren’t hit.
I don’t trade on hope or gut feeling. I trade on process and data. And when you see a momentum signal this strong — backed by decades of historical consistency — it becomes part of your framework for decision-making.
The beauty of this setup is that it’s not just about one good week. It’s about what typically follows. The signal indicates strong statistical backing for the rally to continue, with particularly strong odds of higher prices through October.
That doesn’t mean markets move in a straight line or that we ignore key downside levels. While the evidence points toward continued market strength, it’s crucial to maintain risk management and respect key levels.
If you caught this move as we drifted higher, you know exactly what I’m talking about. If you didn’t, now you know what to watch for next time — because these patterns don’t disappear. They just wait for the right conditions to show up again.
Graham Lindman
Graham Lindman Trading
Follow along and join the conversation for real-time analysis, trade ideas, market insights and more!
- Telegram:https://t.me/+abM5RWRJKrpkNWI5
- YouTube:https://www.youtube.com/@NewMoneyCrew
Important Note: No one from the ProsperityPub team or Graham Lindman Trading will ever contact you directly on Telegram.
*This is for informational and educational purposes only. There is inherent risk in trading, so trade at your own risk.
P.S. My No. 1 Daily setup and What Happens When You Hold Till the Close
I’ve been showing everyone how to target 50% a day in less than an hour…
Every morning using my No. 1 daily setup.
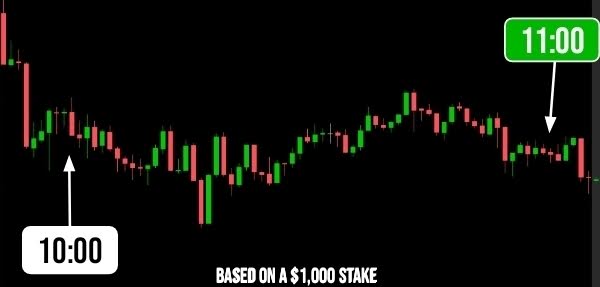
However, if you hold the same trade until the close, that 50% target quickly transforms into what could be a 100% payout!