
🚨I’ll be on at 12:30 p.m. ET🚨
My 2 p.m. ET daily trade has hit on 91.4%* winners over the last 10 weeks — join me at 12:30 p.m. ET to learn the setup targeting $500 by the closing bell [tap to join us]!
There are seasonal patterns, and then there’s what I’m about to show you with Nvidia (NVDA).
We’ve just entered an 11-day window that has produced gains in NVDA for 10 consecutive years — without a single exception.
Not just during bull markets. Not just during calm conditions. This pattern held even during the 2018 bear market, when the broader market dropped roughly 20% in a matter of weeks.
And yet, even as the market was collapsing, NVDA still went higher during this window.
That’s a pattern worth paying attention to. So today we’ll discuss the numbers behind the streak and how I’m trading it.
The Numbers Behind the Streak
The average return for NVDA during this 11-day window is 11%. That’s a significant move compressed into roughly two weeks.
But averages don’t tell the whole story. The recent results have included gains of 0.9%, 5%, 20%, 23%, 24%, 0.2% and 1.4%.
Some years delivered explosive moves while others barely finished positive. The important point is that each one still produced a gain.
Of course, no historical pattern guarantees what happens next. But that consistency across different market environments is rare. When I see something like this, I look for a smart way to participate without requiring the stock to repeat its 11% average.
How I’m Trading This Pattern
I’m not simply buying calls and hoping for the best. Instead, I’m using a wrap order, which is an at-the-money debit spread wrapping the two strikes around current price.
In plain English, that means buying one call under NVDA’s current price and selling another call at a higher strike. The premium collected from the call I sell helps reduce the cost of the call I buy. The trade-off is that the spread’s maximum profit is capped.
Instead of paying about $1,300 for a regular call, I can structure the spread for around $120. That lowers the capital at risk and gives me a defined maximum loss, though the full premium can still be lost if the setup fails.
More importantly, I don’t need NVDA to climb 11% over the next two weeks for the trade to work. Rather than relying on a roughly $22 move, I can structure the position around a much smaller move of about $2.
That matters because the historical results vary widely. If this window delivers another modest gain like 0.2% or 0.9% instead of a 20%-plus surge, the spread is designed to make a smaller move more useful.
This isn’t about chasing hype or gambling on earnings. It’s about recognizing a pattern that has persisted through very different markets, then using a lower-cost, defined-risk structure to trade it intelligently.
Graham Lindman
Graham Lindman Trading
Follow along and join the conversation for real-time analysis, trade ideas, market insights and more!
- Telegram:https://t.me/+abM5RWRJKrpkNWI5
- YouTube:https://www.youtube.com/@NewMoneyCrew
Important Note: No one from the ProsperityPub team or Graham Lindman Trading will ever contact you directly on Telegram.
*This is for informational and educational purposes only. There is inherent risk in trading, so trade at your own risk.
P.S. My Most Consistent Daily Trade…
I’ve been exploiting a weird anomaly happening nearly every afternoon on the NDX…
It’s opened a small two-hour window for anyone to target around $200* by the closing bell.
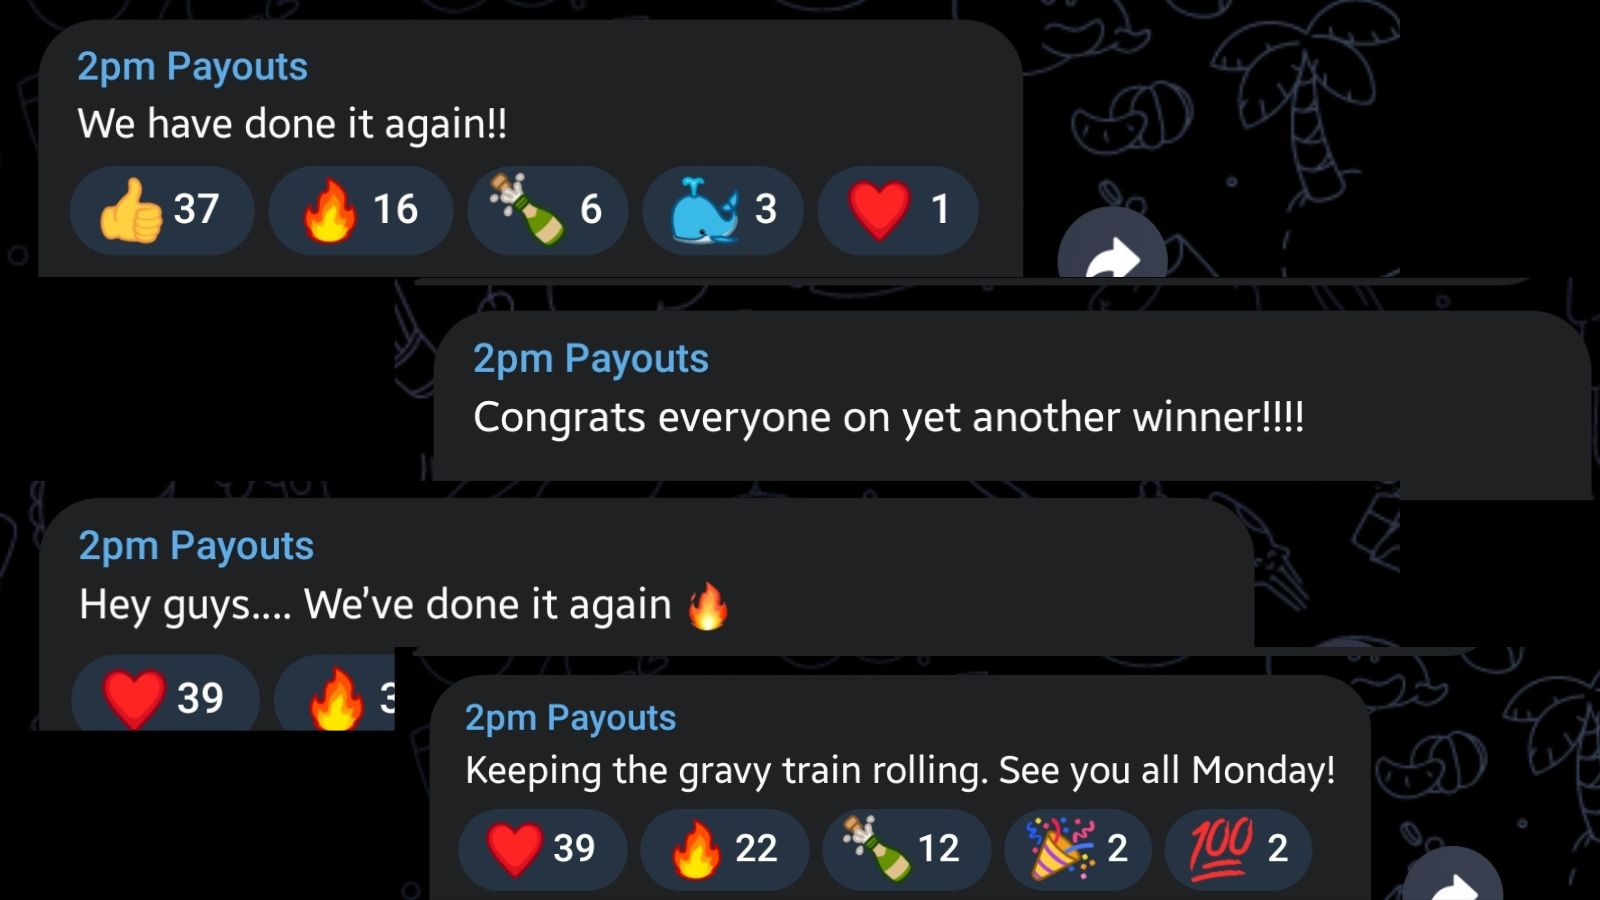
We develop tools and strategies to the best of our ability but no one can guarantee the future. There is always a risk of loss when trading. From May 2022 to July 2026 the backtested win rate was 90% with an average return net of winners and losers of 10% daily on risk. The method has been traded live since July 15th, 2026 and through the first 10 weeks of the beta testing, it’s hit with a 93.3% win rate on LIVE trades.