🚨 Join Alex and Geof live at 2:30p.m. ET🚨
With the Fed and Mag 7 earnings arriving tomorrow, we’re locking in our final positions. Alex reveals how to track institutional flows with the Free Ride Scanner, while Geof breaks down the next big opportunities in energy and metals [tap to join us for Profit Panel]
I’ve been digging into something fascinating lately, and the pattern is too consistent to ignore. There’s an indicator I’ve been tracking called funding spreads, and it offers a real-time view of how global macro investors are positioned across index options, swaps and related instruments.
The signal is not a direct sell trigger, but its historical behavior makes it worth attention. What stands out is how it flagged major shifts this year before volatility picked up.
We saw positioning reduce ahead of the 2025 tariff-driven selloff and again before the U.S.-Iran geopolitical shock. In both cases, the data didn’t just signal downside risk — it also pointed to a squeeze-prone market structure.
That structure mattered. The rebound that followed was heavily concentrated in mega-cap technology, which amplified positioning squeezes. Moves in the Nasdaq 100 (QQQ) accelerated quickly once re-risking began and flows became forced rather than optional.
How the Signal Actually Works
Funding spreads reflect whether professional investors are net buyers or stepping back from exposure. Elevated spreads have historically aligned with constructive forward returns, while tightening spreads often show caution building beneath the surface.
When spreads reverse, it usually happens before broader markets react. That’s what makes the signal useful, especially when combined with headlines, prediction markets and key technical levels.
On its own, it is not a prediction tool. It is better understood as a map of positioning pressure rather than a timing mechanism.
In recent examples, the data highlighted a fragile structure rather than a specific catalyst. Systematic demand had faded but not fully disappeared, which left markets balanced between support and vulnerability.
Even then, hedge funds still had capacity to re-enter if sentiment improved. That created conditions where moves could reverse sharply once flows shifted.
A large part of the action was also driven by CTA activity and systematic re-risking, not just discretionary trading. That added fuel to already uneven market structure.
The positioning signal also aligned with technical conditions. Markets were consolidating and showing signs of weakening structure beneath the surface.
Rather than labeling conditions as simply overbought, the takeaway was that stretched markets can remain extended until something forces a reset. Timing that shift is where most participants struggle.
It’s also important to note how narrow the rally was. A small number of sectors carried most of the upside, which masked broader hesitation in the market.
Seasonality added another layer of confirmation. Even after de-risking, there was still dry powder in the system that could re-enter if conditions stabilized.
Putting It All Together
No single indicator explains the full market picture. That becomes especially true in environments where flows and positioning dominate short-term direction.
But when you combine funding spreads, headlines, prediction markets and price levels, the structure becomes clearer. It also becomes easier to understand when moves are driven by positioning rather than pure fundamentals.
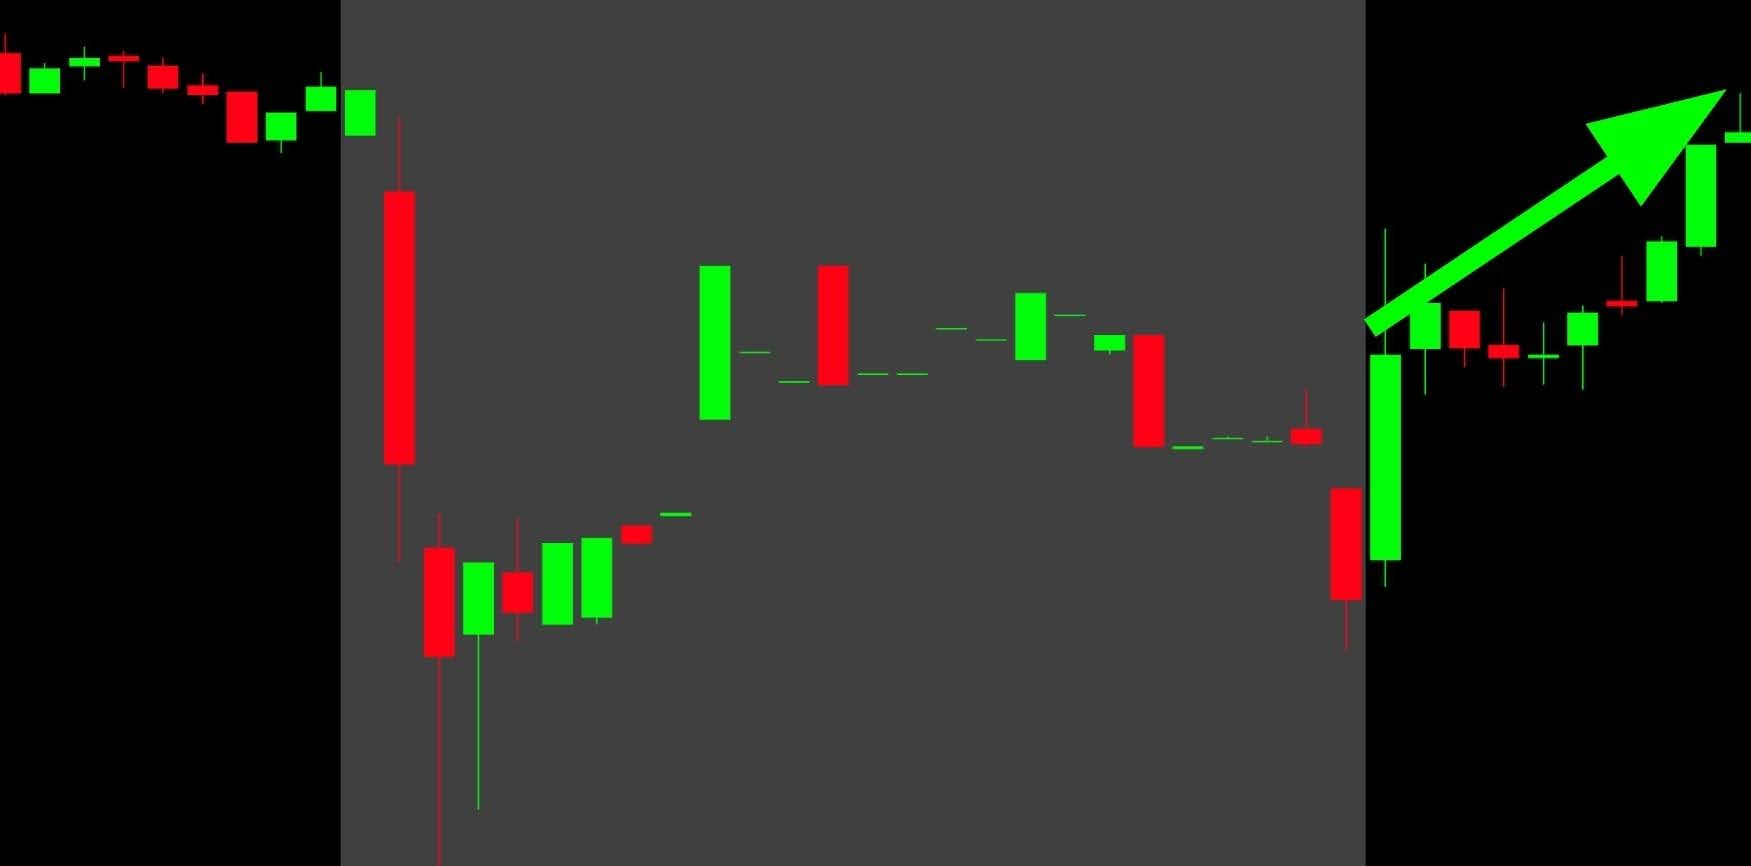
Vertical moves higher are rarely just profit-taking. They often reflect underlying pressure building beneath the surface before a catalyst appears.
This year’s tariff-driven selloff and geopolitical shock both lined up with what positioning data was already suggesting. That doesn’t mean the data predicted the events, but it did show where exposure was becoming fragile.
Professional investors were leaning in the right direction before those moves accelerated. That is the edge — not prediction, but awareness of where risk is building.
The takeaway is not to exit everything. It is to tighten risk when positioning becomes stretched and avoid chasing strength when reward no longer matches the setup.
Institutional positioning won’t forecast every move. But it can help you avoid being on the wrong side of the ones that matter most.
Silas Peters
Silas Peters Trading
Follow along and join the conversation for real-time analysis, trade ideas, market insights and more!
- Telegram: https://t.me/+OhKACOpfD9U0OGUx
Important Note: No one from the ProsperityPub team or Silas Peters Trading will ever contact you directly on Telegram.
*This is for informational and educational purposes only. There is inherent risk in trading, so trade at your own risk.
P.S. Geof’s Special Briefing Could Rattle the Market
Geof Smith is one of the few genuinely respected traders out there.
He’s spent decades in the commodity markets – especially Gold and Silver – refining a setup that’s stood the test of time.
At one point, he was even recruited by a private trading academy in Mobile, Alabama, to lead as both educator and CEO.
So when he shares something new, savvy traders pay attention.
And a few days ago, he made a discovery we couldn’t have seen coming.
It centers around a specific signal that tends to show up early in the trading session.
The kind that can create short bursts of momentum – often before most traders can engage.
Although he’s been noticing these weird signals for a while, there hasn’t been a way to spot and leverage these sharp, quick-paced moves while they happen.
Until now.
Today, anyone with a regular brokerage account can target double, even triple-digit payouts before lunch every day…
All thanks to what he calls 10-Minute Moonshots.
Alex Ried will be joining him live on Wednesday to break this new approach down in detail.

You’ll see:
- What these transactions look like in real time
- Why they tend to appear early in the session
- And how traders can approach them with a structured setup
No guarantees in trading, of course.
But if you’re curious how these short bursts of momentum form.. and how to recognize them… you’ll want to be there.
Disclaimer: We develop tools and strategies to the best of our ability but no one can guarantee the future. The profits and performance shown are not typical to any one individual and you may lose money. The trades shown are from historical data in order to demonstrate the potential of the system..