🚨 I’ll be live at 10 a.m. ET with Graham Lindman🚨
We’ll take a look at some charts of the week including some insane numbers of what’s happened when the VIX falls 40% in less than two weeks, BIG earnings this week and more [tap to join us for Opening Playbook]
Here’s something that might sound crazy: Buying all-time highs isn’t just safe — it’s one of the smartest things you can do. I know it feels wrong, like you’re late to the party and about to get burned, but the data tells a very different story.
Recently, I dug into weekly S&P 500 (SPY) data going all the way back to 2004, and what I found completely changed how I think about market timing. Because here’s what most traders miss: All-time highs don’t show up alone — they show up in bunches.
You don’t get one all-time high followed by months of chop. You get stretches where they stack — week after week — and when that happens, it’s telling you something real is happening under the surface.
The Pattern Hidden in Plain Sight
When I pulled the data and labeled every week that closed at an all-time high, the pattern jumped out immediately. You see long quiet stretches, then suddenly — boom — cluster after cluster.
And this isn’t just about up weeks, which is where most people get it wrong. They look at green versus red and think that’s the whole story, but it’s not. All-time highs tell you something deeper: Strength is broad enough to lift every entry point back into profit, which is a completely different level of confirmation.
One stat really stood out: After an all-time high close, the market goes on to at least touch higher about 99% of the time. It might only be by a small margin, but that consistency is hard to ignore, and if buying highs makes you uncomfortable, that stat alone should make you rethink it.
All-time highs aren’t just momentum — they’re recovery, strength and confirmation all rolled into one. So when you see one, it’s not a warning sign, it’s a signal, and while you might get a brief pullback, more often than not it’s followed by more highs.
The 400-Week Test
Here’s where it gets even more interesting. I looked at the period around 2008 — one of the toughest stretches in modern market history — and we went roughly 400 weeks without a single all-time high.
Four hundred weeks, and during that entire stretch there were no fakeouts. No isolated all-time high that pulled traders in only to roll over into another multi-year drawdown.
Zero.
Once all-time highs started appearing again, they kept coming. That’s what makes this such a powerful signal — it doesn’t tease you, it either shows up in force or it doesn’t show up at all.
And when it does, that’s when you want to be paying attention. So the next time you see the market hitting all-time highs and feel the urge to wait for a pullback, remember this: That pullback might not come, and if it does, it’s likely just setting up the next move higher.
All-time highs are one of the clearest signals of what’s actually happening in the broader market, and when they start clustering together, that’s not the time to get cautious — it’s the time to get involved.
Now don’t forget to join us at 10 a.m. ET weekdays for Opening Playbook, and at 3:30 p.m. ET Closing Playbook!
Nate Tucci
Tucci Trades
Follow along and join the conversation for real-time analysis, trade ideas, market insights and more!
- Telegram: https://t.me/nate_tucci
- YouTube: https://www.youtube.com/@NewMoneyCrew
Important Note: No one from the New Money Crew team or Tucci Trades will ever contact you directly on Telegram.
*This is for informational and educational purposes only. There is inherent risk in trading, so trade at your own risk.
P.S. We’re Going After My 100th Trade — Killing a Bird With 2 Stones
I’ve been deploying a unique approach to the market for at least 15 months. One that allows me target cash whichever direction the market or the stock decides to go.
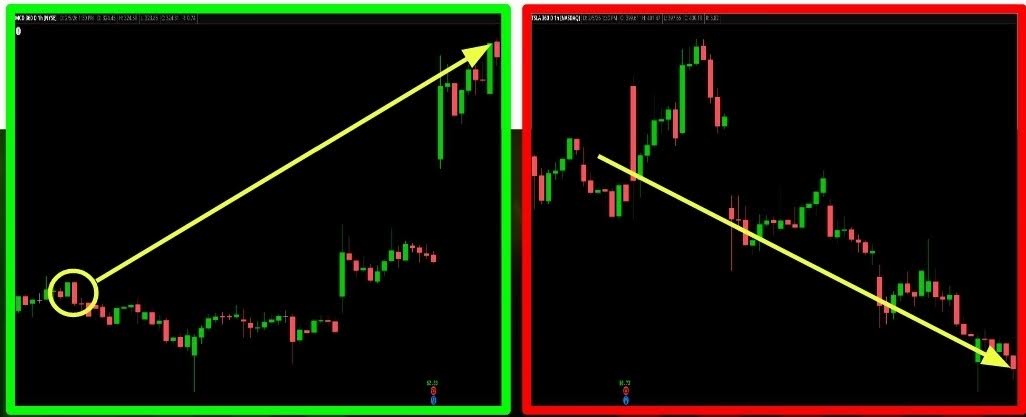
The next opportunity opening up right now is our 100th trade and I would like you to join in on the milestone with me.
Disclaimer: We develop tools and strategies to the best of our ability, but no one can guarantee the future. There is always a risk of loss when trading past performance is not indicative of future results. Since 1/12/24, the strategy has issued 99 closed trades, for a total win rate of 72.8%. The average gain, winners and losers included, has been 5.12% per trade over an average holding period of 20 days.