🚨 I’ll be live at 10 a.m. ET with Graham Lindman🚨
It’s Friday so you know what that means — it’s time to cover the next leg of our ongoing gold trade, then we’ll wrap up the week and David will cover how to trap price movement inside or outside of a box [tap to join us for Opening Playbook]
Something’s changing in the market, and before you jump to conclusions — no, I’m not turning bearish. Not even close.
But I’m seeing a real shift in how the market’s moving, and it’s important you understand it because it’s going to affect how you trade over the next couple of months.
We’re transitioning from a pure liquidity environment to a market that’s picking spots, and that shift is happening right in front of us.
In the first 15 minutes of a recent session, we saw Technology (XLK) and Industrial (XLI) trading down while Utilities (XLU), Energy (XLE) and Health Care (XLV) moved higher. That’s not your typical risk-on day — that’s rotation, and rotation changes everything.
Understanding Sector Rotation
We’re now seeing rotation show up intraday, not as a massive, broad shift that flips the entire market, but as a steady flow of capital moving between sectors.
For a long stretch, any positive day meant liquidity came in and lifted every sector together, with everything moving as a unit. But now the market’s getting more selective, with some sectors catching bids while others pause or pull back, and that behavior is deliberate, not chaotic.
We’re also seeing this play out beneath the surface, where XLK has started to pause while market breadth is actually improving, with roughly 50% of stocks now trading above their 200-day moving average, a notable jump from the 40% levels we saw back in March.
That kind of participation shift matters because it tells you this isn’t a narrow rally driven by a handful of names, but a broader, healthier structure where capital is rotating instead of concentrating.
This shift creates a more stable environment, as capital spreads across different areas instead of pushing everything in one direction, which naturally leads to fewer outsized moves and a transition in volatility rather than a collapse.
There’s also some solid historical context backing that up, with 579 sessions showing similar early setups over the past 20 years, and 385 of them finishing higher from 9:45 a.m. ET through the close.
That kind of consistency reinforces how rotation can support a more predictable trading environment, even as volatility evolves.
Intraday behavior is reinforcing this as well, with the strongest concentration of movement often happening earlier in the session when measured from the prior close, giving traders a clearer read on where real flow is going when it’s paired with selective sector strength.
Why I Expect ATR to Transition — Not Collapse
Let me be very clear: I still expect the Average True Range to evolve through May and June — but not in a straight-line decline.
We’re already seeing signs of that transition, with the Cboe Volatility Index (VIX) recently pushing toward 19.31 while crude dynamics, with Brent crude holding near $112, are keeping a firm bid under volatility in the near term.
That matters because before volatility compresses, it often stabilizes at higher levels, especially when macro inputs like energy are adding friction to the system.
So what’s likely is not an immediate drop in ATR, but a more uneven, selective shift where volatility stays elevated in pockets while the overall structure becomes more controlled.
You still need broad participation across sectors, or a major surge in XLK, to generate those big 1.5% or 2% daily moves.
When money rotates instead of surging uniformly, the net effect is smaller net ranges, even if intraday volatility remains active, and that’s where traders tend to get caught off guard.
A lot of traders see shrinking ATR and assume momentum is fading or the market’s topping, but that’s not what’s happening here — this is a normal evolution into a more mature, selective growth phase that can still carry elevated volatility while becoming more controlled directionally.
From a structural standpoint, the S&P 500 (SPY) is now working through the $7,100 area, which I view as a consolidation zone ahead of a potential push toward the $7,200 institutional targets into the summer, and that type of price action fits perfectly with a rotation-driven tape.
So what does this mean for your trading?
It means strategies that thrived on uniform, high-velocity moves may need to adjust, sector selection matters more, and we’re likely shifting into a high-handle, selective volatility environment where both upside and downside moves become more measured, even if volatility doesn’t immediately disappear.
Risk-on and risk-off are playing games right now with a very interesting sector mix, and that’s not weakness — it’s a healthy market evolving beyond brute-force liquidity and into smarter, more purposeful flows.
If you can recognize and adapt to that rotation instead of fighting it, you’ll have a real edge in the weeks ahead.
Stay sharp out there.
Now don’t forget to join us at 10 a.m. ET weekdays for Opening Playbook, and at 3:30 p.m. ET Closing Playbook!
Nate Tucci
Tucci Trades
Follow along and join the conversation for real-time analysis, trade ideas, market insights and more!
- Telegram: https://t.me/nate_tucci
- YouTube: https://www.youtube.com/@NewMoneyCrew
Important Note: No one from the New Money Crew team or Tucci Trades will ever contact you directly on Telegram.
*This is for informational and educational purposes only. There is inherent risk in trading, so trade at your own risk.
P.S. We’re Going After My 100th Trade — Killing a Bird With 2 Stones
I’ve been deploying a unique approach to the market for at least 15 months. One that allows me target cash whichever direction the market or the stock decides to go.
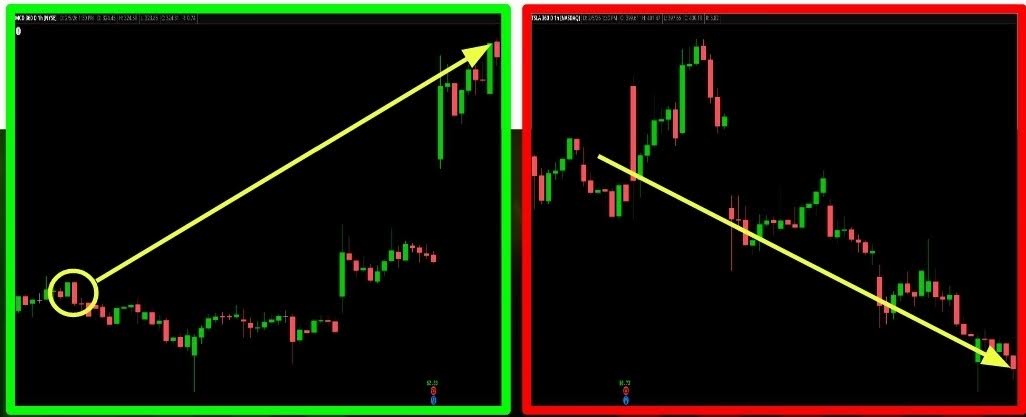
The next opportunity opening up right now is our 100th trade and I would like you to join in on the milestone with me.
Disclaimer: We develop tools and strategies to the best of our ability, but no one can guarantee the future. There is always a risk of loss when trading past performance is not indicative of future results. Since 1/12/24, the strategy has issued 99 closed trades, for a total win rate of 72.8%. The average gain, winners and losers included, has been 5.12% per trade over an average holding period of 20 days.