🚨I’ll be live at 10 a.m. ET with Graham🚨
Are we back in the buy zone? We’ll discuss that, the most powerful way for retail traders to get a systematic advantage and more [tap to join us for Opening Playbook]
Most traders think about probability all wrong.
They focus on where a stock or index might close and ignore the path it takes to get there.
But sometimes the probability of price reaching a level intraday is dramatically higher than the probability of actually finishing there.
That gap is where some of the best opportunities live.
Before getting into the setup, it’s worth understanding the backdrop.
We’ve been seeing some of the most negative intraday action we’ve had in quite a while. Sessions with this kind of bearish continuation profile are rare, especially during a broader bullish trend.
Historical data shows that expected downside readings at these levels don’t appear very often. The average move to the downside during the session is roughly 0.7%, which is already significant.
We were already approaching that magnitude of weakness early on Friday.
At the same time, defensive sectors have been firming while technology has been under pressure for a second consecutive session.
That’s an important shift because it suggests money isn’t automatically rotating back into risk the way it often does during routine pullbacks.
There’s also an interesting structural change happening around Fridays…
You would think the rise of 0DTE trading would smooth out end-of-week volatility because so much positioning is resolved intraday. Instead, Fridays have become increasingly prone to outsized downside moves.
For whatever reason, the market structure appears to be amplifying volatility rather than dampening it. That’s the environment that led me to a fascinating SPY setup.
The 7x Probability Gap
When I ran the concentration data, one number immediately jumped out.
The market had a relatively high probability of reaching roughly the $754 area intraday. Yet the probability of actually closing above that level was dramatically lower.
In other words, the market was likely to visit the level but unlikely to stay there.
That’s a completely different trade than most people are thinking about.
Many traders see a projected upside level and immediately assume it represents a bullish opportunity. But if price is likely to touch that area and then fade, the better trade may actually be positioning against the move rather than chasing it.
That’s where the edge begins to emerge.
Selling Into Strength
My thought process was straightforward.
If SPY managed to rally toward the $758 area during the session, selling a credit spread above that $758 level could become a very high-probability setup.
The challenge, of course, is that high-probability trades often come with low premiums.
That problem becomes even more pronounced when volatility refuses to cooperate.
VIX has remained stubbornly subdued despite pockets of weakness in the broader market.
Normally you’d expect volatility premiums to expand when markets come under pressure. Instead, we’ve seen volatility stay relatively contained, which compresses option premiums and makes trade selection even more important.
Even so, the underlying probabilities remain valuable.
The data suggested that although an intraday bounce was certainly possible, roughly 73% of comparable sessions still finished lower by the close.
That distinction changes the mindset entirely.
Instead of buying the dip, you’re looking to sell strength.
How I Use Concentration Data
The foundation of this approach is concentration analysis.
Rather than attempting to predict exactly where the market will finish, I focus on where price historically tends to cluster under similar conditions.
When I calculated the concentration ranges from the 9:45 a.m. price, the clustering around the $748 to $752 zone was only about 37%.
That’s not especially tight.
What stood out even more was the downside tail risk. Approximately one-third of outcomes continued significantly lower, creating a meaningful probability of a move toward the $746 area.
That doesn’t guarantee the market will get there.
It simply tells me the downside distribution remains much heavier than many traders assume.
And that’s useful information when structuring risk.
Now, I’ll be the first to acknowledge the limitations. The sample size was only 143 sessions. That’s not enough data to treat the exact levels as gospel.
But it is enough to identify tendencies.
And tendencies are often all you need.
When Volatility Doesn’t Cooperate
One complication in the current environment is that volatility isn’t paying traders the way it normally would.
When VIX remains compressed, premium-selling opportunities can become less attractive because the reward side of the equation shrinks.
In those situations, I don’t force trades.
Sometimes a Two-Way Options structure or Profit-Pairs approach makes more sense because it allows me to express the same directional view without relying entirely on volatility expansion.
The goal isn’t to force a specific strategy.
The goal is to exploit the probability edge.
Trading the Odds, Not Predictions
What I like most about this framework is that it removes the need to predict the future.
I don’t need to know where SPY will close, I don’t need to know what headline hits at noon, nor do I need to know what the next tweet, economic report or geopolitical surprise will be.
I just need to identify situations where the probabilities become skewed.
When the market has a much greater chance of reaching a level than holding it, that creates opportunity.
And when you find a setup where the probability of an intraday move is seven times higher than the probability of finishing there, you’re no longer trading opinions.
You’re trading math.
And that’s an edge I’ll take every time.
P.S. Want an exclusive first look at what I’ve been building behind the scenes? Join my beta testing group here before we close the doors.
Nate Tucci
Tucci Trades
Follow along and join the conversation for real-time analysis, trade ideas, market insights and more!
- Telegram: https://t.me/nate_tucci
- YouTube: https://www.youtube.com/@NewMoneyCrew
Important Note: No one from the New Money Crew team or Tucci Trades will ever contact you directly on Telegram.
*This is for informational and educational purposes only. There is inherent risk in trading, so trade at your own risk.
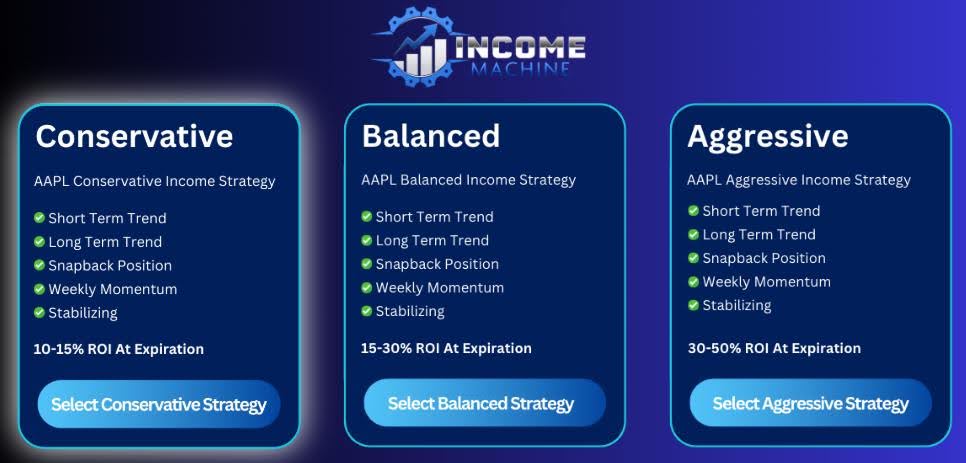
P.S. I Stunned My Entire Team When I Gave This Income Secret Out
I stunned everyone on my team not so long ago.
I exposed my top income secret completely for free.
For months now, folks have been using this same Income Secret…
Without the hassle of overthinking about what setup to trade…
Without stressing about portfolio size…
And without being overwhelmed about how long to hold a position before they exit!
Allowing them to target healthy gains depending on their risk preference and desired approach.
Today, I’m handing you free access to my Income Secret.
Even better, you’ll see the market phenomenon powering the income secret.
Of course, I can’t make guarantees on the market…
But if you’d like to get started on the Income Secret as soon as today…
Here’s Where to Go for Free Access
Disclaimer: We develop tools and strategies to the best of our ability, but we can’t guarantee the future. There is always a risk of loss when trading. Past performance is not indicative of future results. While we have used the Income Machine with great success, we cannot guarantee future results. What you will see today are some of the best examples over the last few months. There were bigger winners, smaller winners, and losers. Since the Income Machine is a tool for traders and not a trading service, profits and performance will vary among users.