🚨 I’ll be live at 10 a.m. ET with Graham Lindman🚨
Graham will cover his weekly gold trade times 2 since he was away last week and much more [tap to join us for Opening Playbook]
Here’s something that’s bothered me for years.
Everyone in this business measures market performance the same way — from yesterday’s close to today’s close. You’ve seen it a million times: the S&P 500 (SPX) was up 0.8% today, or 72% of similar days close positive. It sounds helpful, but for actual trading decisions, it’s pretty close to useless.
Think about it. If the market gaps up 0.5% at the open and you’re sitting there at 9:45 a.m. ET trying to figure out your next move, what good does it do to know the market usually closes positive from yesterday’s close? The market could drop 0.4% from where it is right now and still finish green versus yesterday. That’s not an edge — that’s just math working against you.
The Measurement Shift That Actually Matters
That’s exactly why I spent so much time building a custom database that measures things differently. Instead of comparing everything to the prior close, I measure performance from 9:45 a.m. forward — right before our Opening Playbook meeting.
That’s the moment that actually matters. That’s when real decisions are being made with real money. The open already happened, the overnight move is baked in and now the question is simple: what tends to happen from here into the close?
Once you shift your focus to that timeframe, the data starts to become a lot more useful.
The Gap Problem Everyone Ignores
The biggest flaw in the traditional approach is how it handles gaps. If the market opens up 0.2%, all those positive close statistics are immediately skewed. You’re starting the day with a built-in gain, which makes the probabilities look stronger than they really are.
It’s like timing a race but letting everyone start 10 yards ahead of the line. Of course the results look better.
When you remove that distortion and measure from 9:45 a.m. forward, you get a much cleaner picture. You’re no longer mixing overnight movement with intraday behavior. You’re isolating the part of the session where traders actually have control.
In similar market conditions recently, about 62% of sessions moved higher from 9:45 a.m. into the close. That’s a very different statistic than saying the market closed higher on the day. It reflects what actually happens from the moment you’re making decisions, not from some arbitrary reference point.
Why This Changes How You Trade
At the end of the day, this comes down to relevance. When you’re placing trades in the morning, you need probabilities that reflect what tends to happen next, not what already happened overnight.
From that 9:45 a.m. window, the average up move has been around 0.35% into the close. That may not sound like much, but it’s grounded in reality. It’s based on the portion of the day where you’re actually participating in the market.
Most traders repeat statistics that sound impressive but don’t translate into actionable insight. Once you start measuring from the right point, the difference becomes obvious. You’re no longer guessing or leaning on distorted data — you’re working with probabilities that actually align with your decision-making process.
So the next time you hear a market stat, ask yourself whether it’s measured from a point that matters. If it’s not, there’s a good chance it won’t help you trade any better.
Now don’t forget to join us at 10 a.m. ET weekdays for Opening Playbook, and at 3:30 p.m. ET Closing Playbook!
Nate Tucci
Tucci Trades
Follow along and join the conversation for real-time analysis, trade ideas, market insights and more!
- Telegram: https://t.me/nate_tucci
- YouTube: https://www.youtube.com/@NewMoneyCrew
Important Note: No one from the New Money Crew team or Tucci Trades will ever contact you directly on Telegram.
*This is for informational and educational purposes only. There is inherent risk in trading, so trade at your own risk.
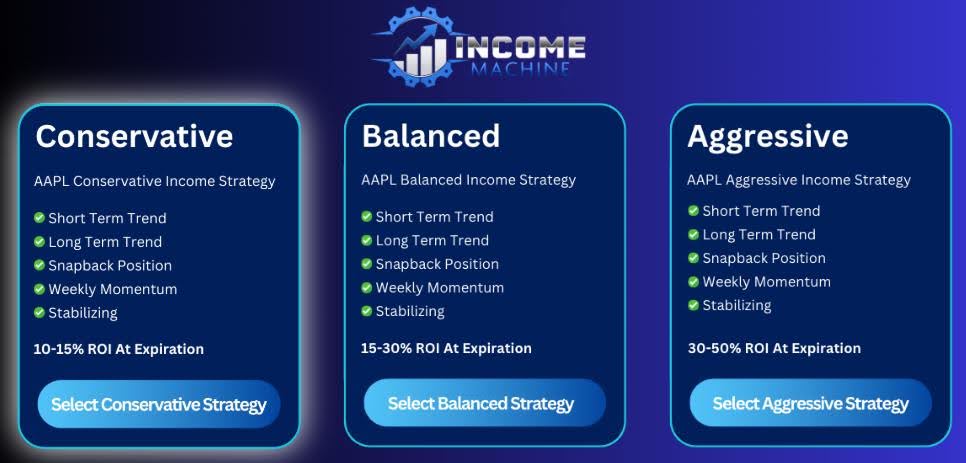
P.S. Want Free Access To My Top Income Secret?
You’ll see how to target $250, $500 and even $1,000 on a $2,500 stake every single week from the market, regardless of what happens next after the Iran war ceasefire.
Disclaimer: We develop tools and strategies to the best of our ability, but we can’t guarantee the future. There is always a risk of loss when trading. Past performance is not indicative of future results. While we have used the Income Machine with great success, we cannot guarantee future results. What you will see today are some of the best examples over the last few months. There were bigger winners, smaller winners, and losers. Since the Income Machine is a tool for traders and not a trading service, profits and performance will vary among users.