Time is money.
Or, more precisely, time costs money. And thanks to the Federal Reserve, money costs a lot less over time than it did 20 years ago.
On the eve of the 21st Century, the Fed managed the price of borrowing money overnight at 5.3%. Today, it sits at 0.06%.
And that manipulation has brought the cost of money down across the board, whether you borrow money overnight or for 30 years.
For example, the price of risk-free money for 5 years went from 6.36% to 1.43%. For 10 years, it went from 6.45% to 1.41%. And for 30 years, it dropped from 6.48% to 2.09%.
Interest rates sit at a mere fraction of what they were 20 years ago. That means a dollar worth of profits is worth a lot more now than it used to be.
But traditional valuation metrics don’t account for the price of money. In fact, they miss a lot.
And only when you account for what they miss can you have any clue whether stocks are rich, cheap, or fair…
Driving Up the Value of Profits
It takes a lot more than a simple interest rate to value a stock based on profits.
You must also account for the risk in equity markets. Plus, when a company borrows money, it gets to write the interest expense off against taxes.
Combine all these factors together – interest rates, equity risk premiums, after-tax cost of debt – and you get what we call the cost of capital.
And as the cost of capital falls, equity values rise…just like falling interest rates increase the price of bonds.
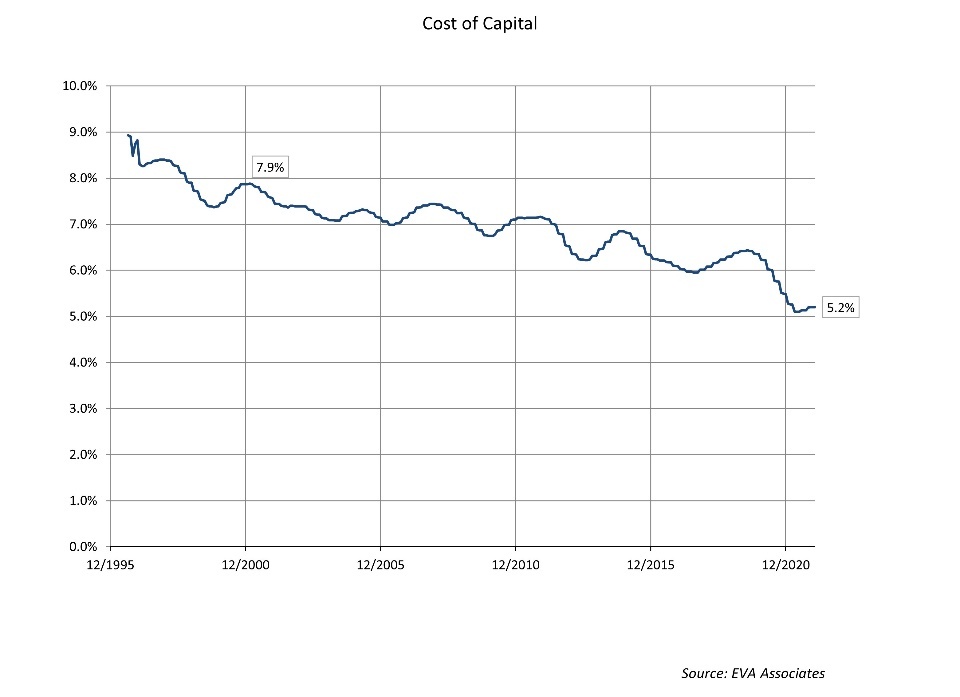
In the chart on the right, I’ve plotted the change in the average cost of capital for all stocks in the S&P 500. And, as you can see, that cost has dropped from around 8% at the end of 2000 to just over 5% today.
And a 3% drop in rates means that every $1 worth of profits is worth 50% more in value – without doing anything else.
That means a company earning the exact same profit as it did 20 years ago would be worth 50% more today – just on falling interest costs alone.
But a lot of other things have happened since then.
Companies have invested in capital. More capital means more profits. And once you add up the capital, and the value of those profits, you can see how much more you’re paying for the privilege of owning a stock.
Adding It All Up
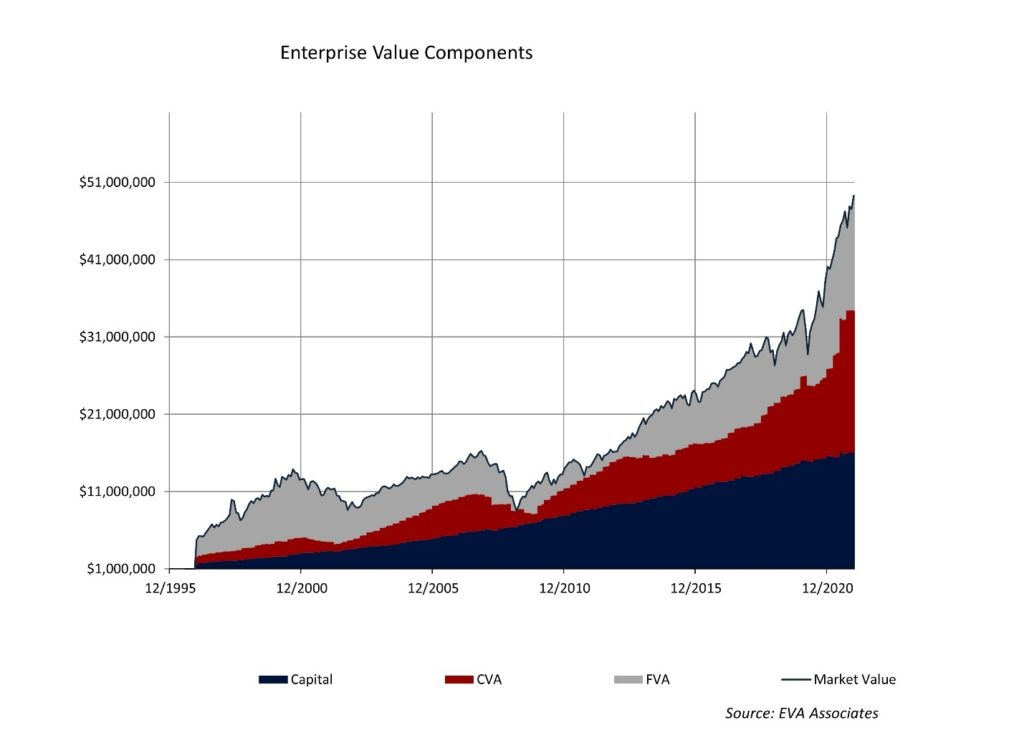
The total market value of all stocks in the S&P 500 currently sits at nearly $50 trillion.
The chart above illustrates how that value has moved over time. Plus, it breaks down that value into three key components – capital, present value of current profits, and any remaining premium.
Of the $50 trillion value, capital accounts for $16 trillion (the big, blue base). To that, we add $18.4 trillion in present value of profits, or CVA for current value add.
That second part, CVA, is where the cost of capital comes has an impact.
Profits of S&P 500 companies (economic profits that is, not earnings), hit $980 billion. Divide that figure by the 5.2% cost of capital and you get $18.4 trillion – or the big red area.
Above that is the premium represented in grey. It’s labeled FVA for future value add and this equals the difference between market value and capital plus profits. It captures how much extra investors are willing to pay above and beyond how much the company invested in its business and the profits that capital generates.
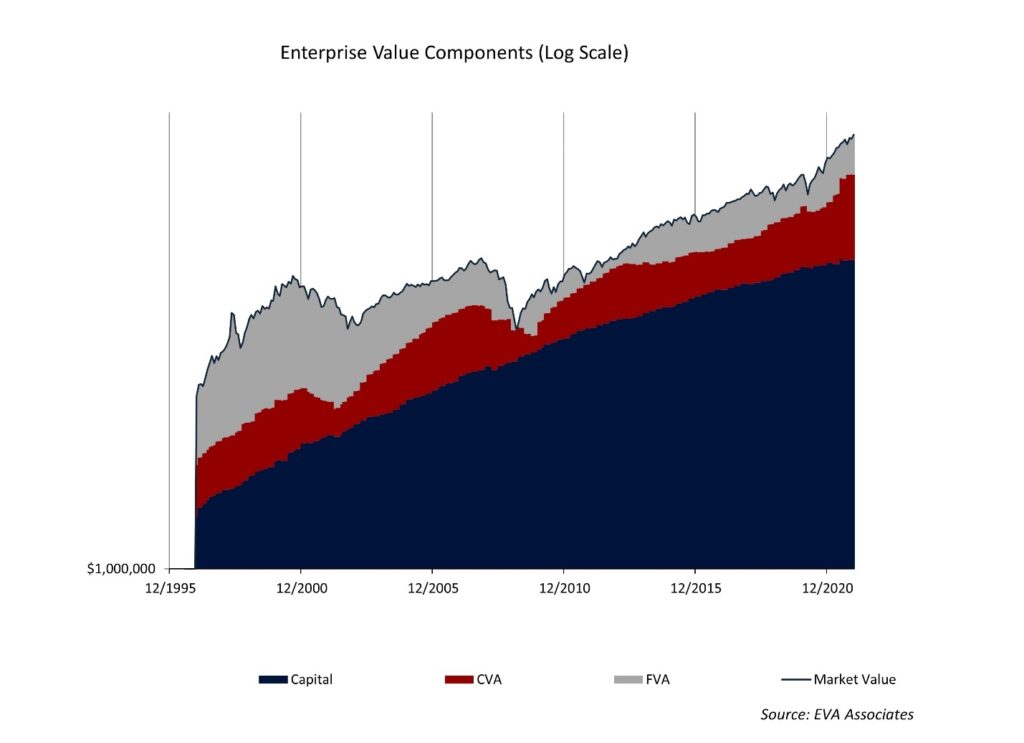
Now, the grey area looks large relative to how it’s looked in the past. But because the total values have gone from less than $5 trillion to over $50 trillion (or a 10X leap in 20 years), the magnitude is skewed because of base effects.
To correct for that, I’ve put the chart on a log scale. And with the context right, you can see that the premium currently baked into to equity prices looks a lot tamer by comparison to the past – especially compared to the “Irrational Exuberance” of the internet bubble.
But let’s put a number on that premium. Specifically, we want to know what percentage of the gap between capital (the big, blue area) and market value (the sum of everything) is dependent upon future profit growth. The higher the percentage, the more you’re relying on future growth to justify current stock prices.
The chart below shows how that premium has shifted over the last 20-plus years.
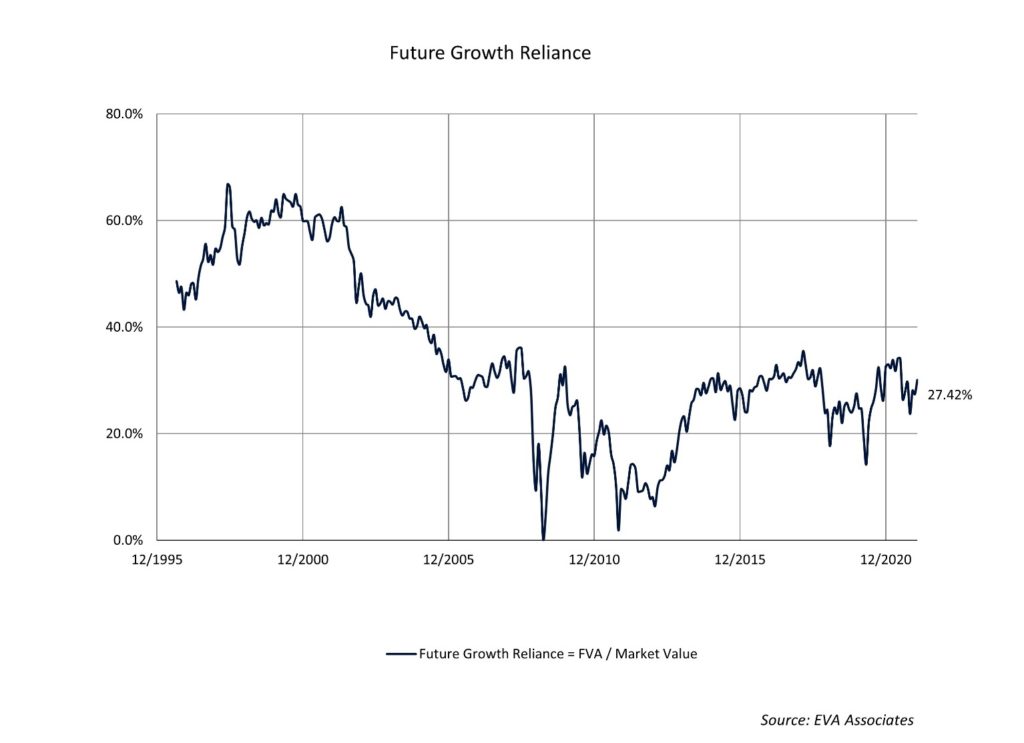
It exceeded 60% in the late 90s, but now sits at a little over 27%. That’s not as cheap as it got during the Great Financial Crises. But you certainly can’t call it rich.
Now, there are plenty of things to worry about. Inflation, geopolitics, global supply chains top the list. But equity valuations aren’t one of them. And only time will tell how much we really should be worrying about the rest.