🚨 Join Alex & Geof at 2:30 p.m. ET🚨
As we wrap up the week, we are looking at high-quality swing trade setups to hold over the weekend. Plus, with the market staging a massive pump today, we break down whether it’s time to fade this rally or ride the upward momentum [tap to join us for Profit Panel]
I’ve been tracking something interesting in the market structure lately, and it’s not what most traders are paying attention to.
Everyone’s glued to the inflation prints, GDP numbers and earnings reports. And sure, those matter. But here’s the thing — price action through month-end and quarter-end is being driven more by flows than fundamentals.
We’re moving through a period defined by the largest options expiration in history alongside significant quarter-end pension rebalancing and a broad reset in positioning across major investor groups.
That kind of institutional repositioning creates enormous mechanical pressure on the tape, often completely detached from whatever narrative traders think should be moving markets.
Add to that the growing influence of systematic and algorithmic flows, and you get an environment where traditional economic signals take a back seat to massive structural forces reshaping the order book.
The Liquidity Squeeze Nobody’s Talking About
Here’s where it gets really interesting. Order book conditions remain a key structural concern. Top-of-book liquidity has compressed to levels last seen during some of the thinnest trading periods — yet share volumes remain elevated.
That combination is toxic. Elevated volume flowing through an order book with limited depth produces outsized price reactions even when the underlying flows aren’t that big.
This divergence between volume and liquidity is defining market structure risk right now. With summer conditions creeping in, the market’s sensitivity to order size is only increasing.
Thin liquidity amplifies every push, and even routine rebalancing flows can look like big directional bets simply because there’s so little liquidity to absorb them.
When we see the S&P 500 (SPX) swing 80 to 100 points, those moves aren’t powered by dramatic shifts in economic outlook — they’re happening in an environment where the order book is razor-thin.
The smallest imbalance can run stops, clear multiple price levels and cascade through an algo-driven market that reacts faster than most traders can process.
What This Means for Your Trading
Right now, almost everything on the screen is flow-driven. The fundamental drivers exist — inflation readings, growth data, rate expectations and earnings — but they’re not what’s dictating day-to-day volatility.
What’s truly moving price is the interaction between massive institutional flows and an extremely thin liquidity environment.
That’s why trader discipline matters more than ever. In a market dominated by mechanical movement, staying calm and refusing to trade emotionally becomes a competitive advantage.
When liquidity is this light, emotional decisions almost always get punished. You need to approach each session with a clear plan, defined risk parameters and the patience to wait for clean setups instead of chasing every whip.
The key is understanding the environment you’re operating in. News is already baked into the chart. Price is reacting not to the news itself but to the liquidity conditions through which that news is being processed.
Your edge comes from recognizing these structural drivers and positioning accordingly.
As summer liquidity tightens and quarter-end pressures continue unwinding, expect more exaggerated moves on less real information.
Small flows will keep creating big swings.
Respect the tape, understand the mechanics and trade with discipline.
Silas Peters
Silas Peters Trading
Follow along and join the conversation for real-time analysis, trade ideas, market insights and more!
- Telegram: https://t.me/+OhKACOpfD9U0OGUx
Important Note: No one from the ProsperityPub team or Silas Peters Trading will ever contact you directly on Telegram.
*This is for informational and educational purposes only. There is inherent risk in trading, so trade at your own risk.
P.S. JD’s Next Set of Trades Will Never Make the Headlines
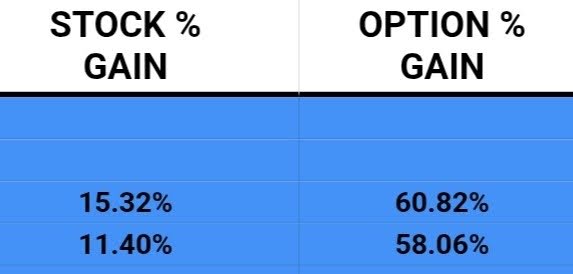
Do you trade Bloom Energy (BE)?
How about Coeur Mining (CDE)?
Now, if you only trade headline stocks or tech names, the answer is probably “no.”
But thanks to a unique trading signal that points traders right in the direction of little-known stocks gearing up for a breakout…
JD was able to spot a 60% on BE and a 58% ROI on CDE — both in 7 days or less.
And guess what? These aren’t even the largest ones he’s seen.
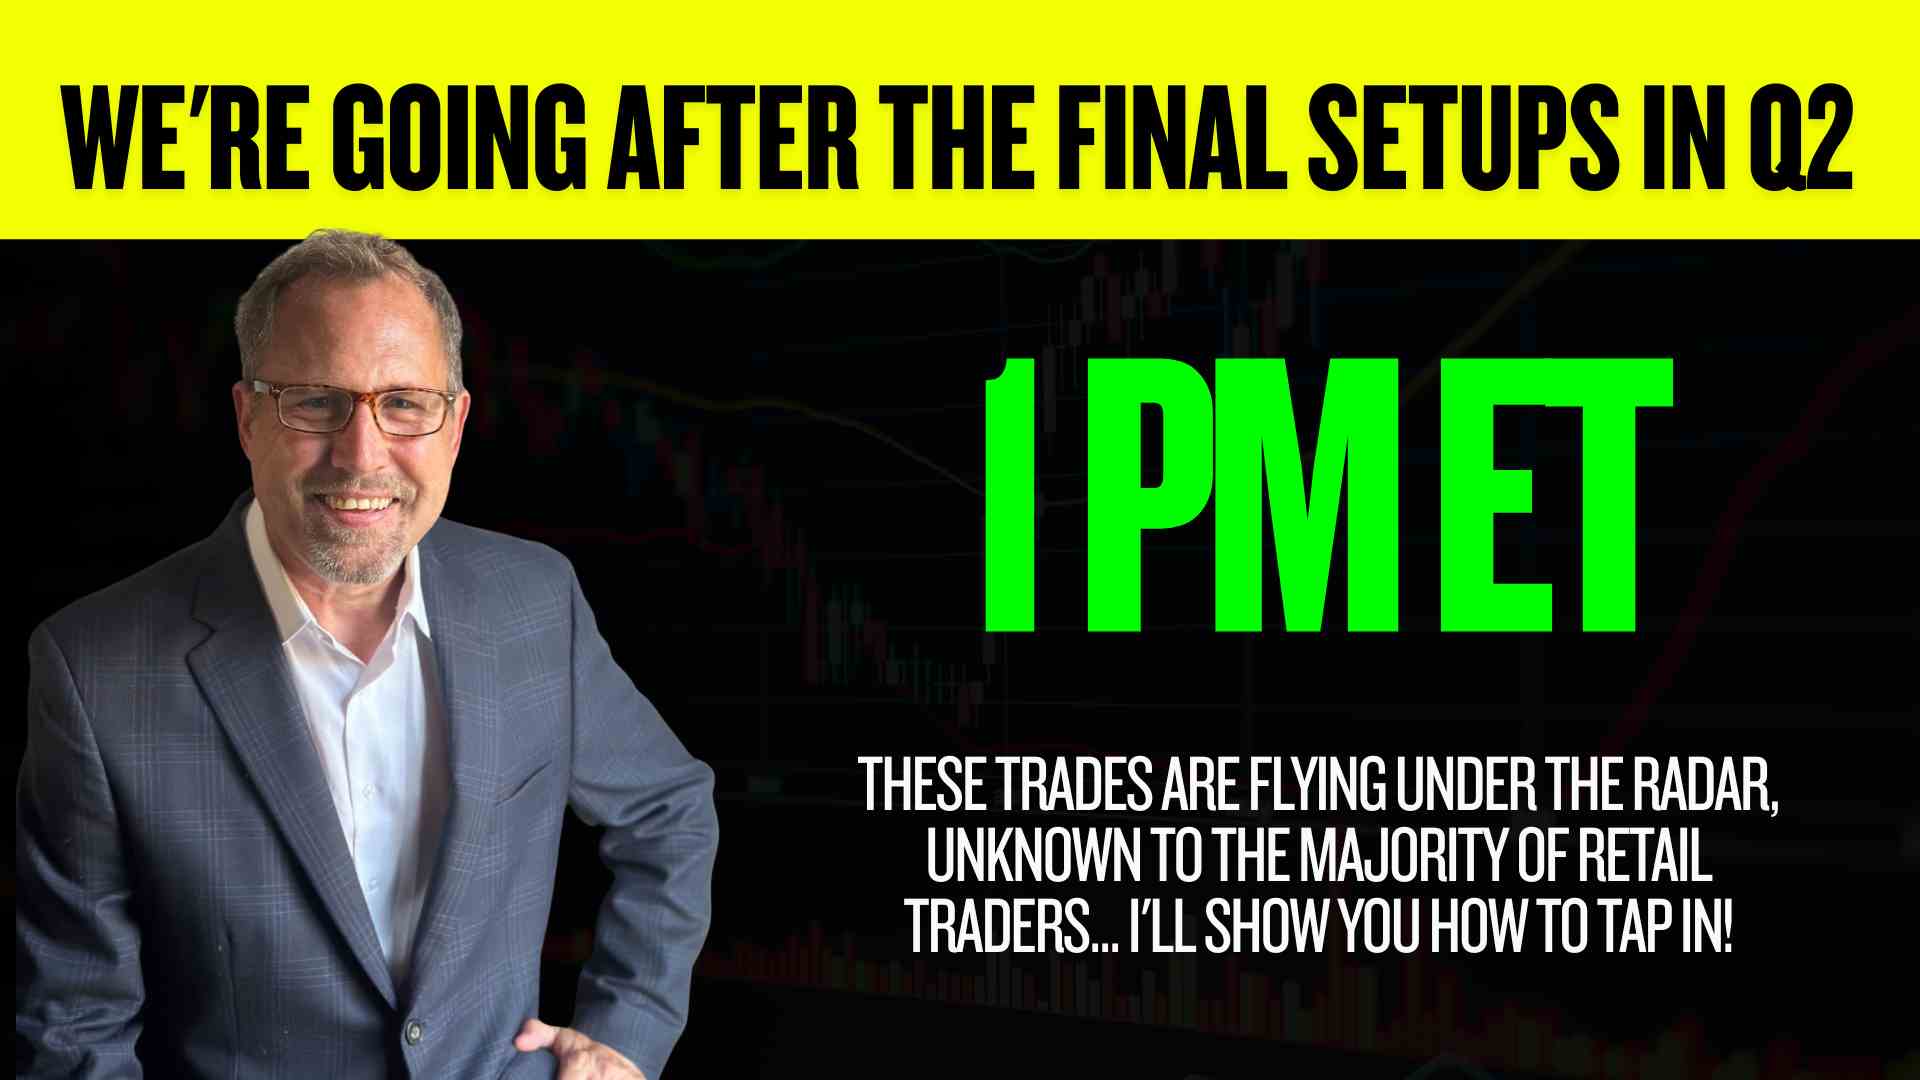
As we come to the end of Q2, certain obscure names will begin skyrocketing into Q3, and he’s got a pretty good idea of the best ones.
He’ll share them with you at 1 p.m. ET today.
Of course, he’s seen smaller wins, and even trades that didn’t go our way. Plus, we can’t make trading guarantees.
But some of the best setups show up on stocks that never make the headlines.
Today, he’ll show you how to plug in.
Disclaimer: We develop tools and strategies to the best of our ability, but no one can guarantee the future. There is always a risk of loss when trading past performance is not indicative of future results. In live trades since Nov. 2025, the strategy has won 74% of the time with an average winner of 83.68% with an average hold time of 25 days.