Evidently, the Fed plans to tighten the monetary spigots.
Last week they indicated a plan to reduce the pace of buying long maturity treasury and mortgage-backed bonds by $15 billion per month. This action takes them from their current $105 billion in monthly purchases to $90 billion for November, $75 billion in December, and so on.
Unless, of course, conditions change. And with supply lines blowing up worldwide and energy costs soaring – oil prices have doubled over the last year – the odds of conditions changing remain high.
The FOMC (Federal Open Market Committee) pointed to strengthening economic activity and fiscal stimulus to justify the move.
Now, less buying in no way means tighter policy, just less loose. Besides, the Fed still maintains overnight borrowing rates at zero, exactly as they stood in 2009 during the depths of The Great Financial Crisis.

Notably, they still cling tightly to the “transitory inflation” message. Suggesting the money mandarins believe that supply-line constraints, labor-strikes, and vaccine mandates eliminating workers from an already understaffed workforce present nothing more than short-term technical challenges.
But I learned a longtime ago to give as much credit to Federal Reserve statements as they give depositors – zero. Every major move dating all the way back to the Asian Financial Crisis of ’97 has amounted to nothing but a string of policy errors over 25 years long. And they no longer craft messages to guide markets but create an illusion of control.
Instead, when it comes to inflation expectations, I let the bond markets guide me. Starting with one key number…
The World Through Bond Colored Glasses
Bonds are elegant.
The coupon and principal payments on bonds provide a highly stable stream of cash flows, at least compared to stocks. That relative stability allows you to compare one bond’s yield to another to tease out all kinds of information that would otherwise get drowned out by price volatility.
And it all starts with the fact that U.S. treasuries essentially carry no risk of default (that’s the power of the printing press, after all).
So, with a default risk-free yield in hand, you can then take some interesting measurements.
For instance, compare the yield of a corporate bond to a treasury bond (making the necessary adjustments, of course) and you can see how big a premium investors demand to get compensated for different degrees of credit risk.
Compare the yield of a government-backed mortgage to a treasury bond, and you can see how much investors need to be compensated for getting their money back earlier than expected (yes, that’s actually a bad thing).
Bond yields are also critical to determining a company’s cost of capital and whether it creates value for shareholders.
And importantly today, treasury bonds also tell us how much inflation markets expect over the next few years.
Nominal Risk
Typical treasury bonds might not carry the risk of default. But that doesn’t mean they are truly “risk-free.”
The coupons and principal that you get from a 10-year Treasury, for example, are fixed. Which means you know nominally how much you can expect to receive over time. But you don’t know what those fixed payments will buy when you finally receive them.
Will that $50 coupon payment in five years buy you a date night at the movies or a hot dog and a coke? Will a $1,000 principal payment in 10 years pay one month’s rent or a tank of gas?
In other words, typical treasury bonds (let’s call them nominal bonds) don’t protect you from inflation. For that, you need TIPS, or treasury inflation protected securities.
TIPS, like nominal bonds, are bonds issued by the U.S. Treasury. They are default-risk free just like nominal bonds, but the principal and coupon payments both adjust higher for inflation – as measured by the CPI (Consumer Price Index).
Should CPI rise 10% over the next ten years, then your final principal payment will be $1,100 instead of $1,000. And the coupons get paid based on how much the principal adjusts.
So, the yield on TIPS reflect the price investors are willing to pay for a bond with no default or inflation risk, while nominal bonds only price in default. That leaves inflation as the only difference between nominal yields and TIPS.
And when you subtract TIPS yields from nominal treasury yields, you’re left with an estimate of the market’s inflation expectations.
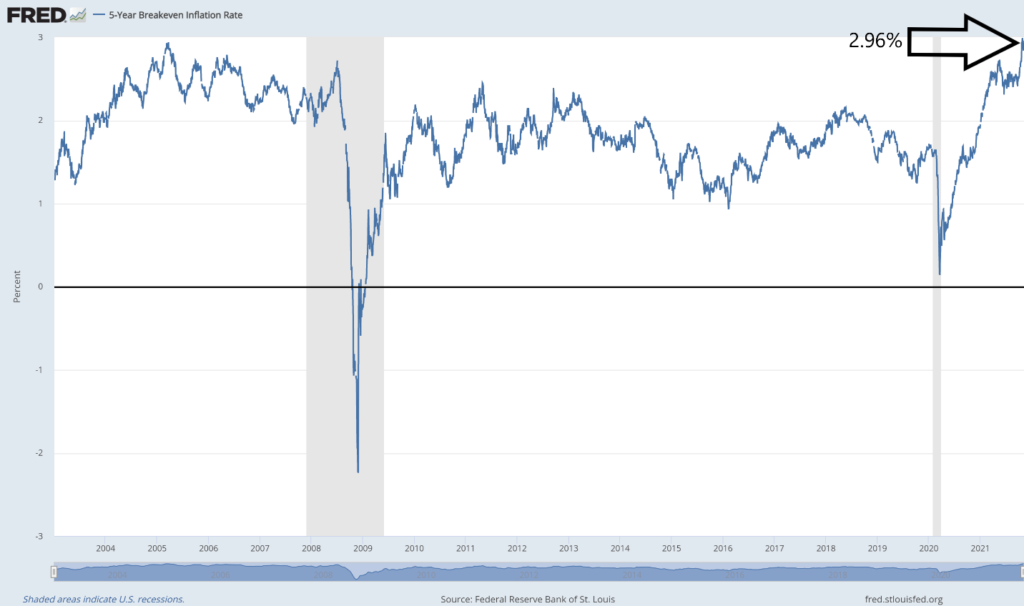
The chart below shows the difference in yield between 5-year maturity nominal treasuries and TIPS.

And at 2.96%, it is telling us that the market expects inflation to average 2.96% per year over the next five years.
At that rate, your money is worth about 10% less over five years. That is high, but not hyper-inflation high.
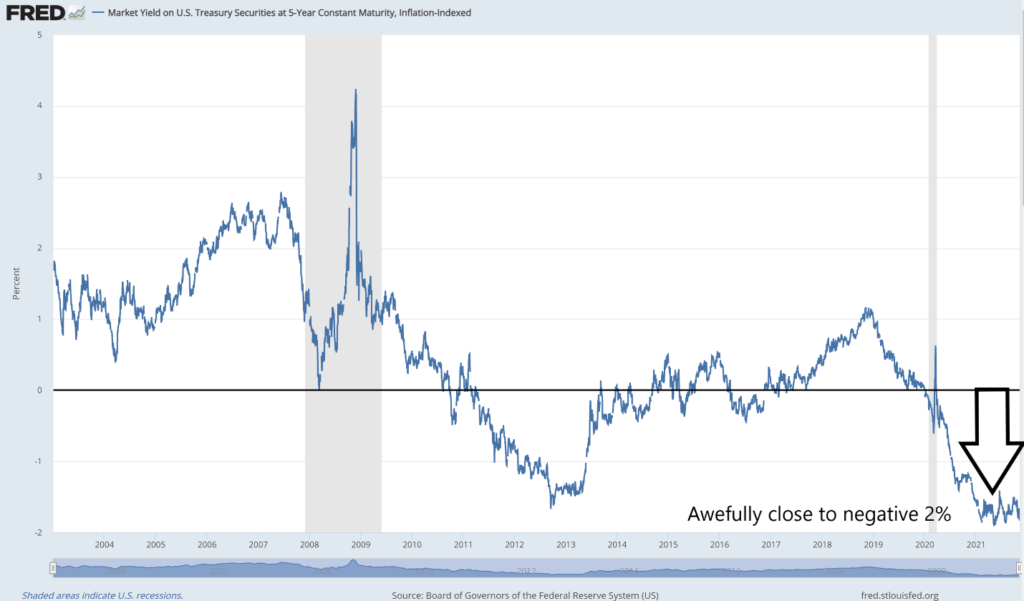
What’s more alarming is just how steeply negative TIPS yields are today.
Less Loss
Now, negative yields mean that people actually pay more for a bond than they expect to get back in principle. It’s a sign of fear. Imagine that you are so afraid of losing money, that you would rather lock in losing a little than losing a lot. And at close to negative 2%, TIPS yields have never been so low.

Negative yields on tips essentially mean that markets have negative growth expectations for the economy (take me at my word for now…it’s a long explanation).
And high inflation alongside slow growth spells an even more pernicious type of “flation” – stagflation.
Which is why the Fed won’t get far with easing off the money-supply pedal. They may hint at buying fewer bonds and slowing the pace of money printing. But as soon as the market tanks because growth is so weak, they’ll be back on the money-printing train.
And that, my friends, could spark even more inflation, turning those “transient” inflationary pressures into something far more permanent.
Wash, rinse, repeat a couple times more, and “stag” becomes “hyper.”
On Friday, I’ll show you not only how to see when inflation kicks into higher gear, but what you can do to get out of the way.
There’s a Spiraling Cost of Order. And I want to help you make One Big Bet against an unsustainable system.


