One of the questions I get asked all the time is how I actually calculate standard deviations when I’m trading. People see me talk about trading at 3 sigma or positioning at certain probability levels, and they want to know the mechanics behind it.
Before anything else, it’s important to understand that delta and sigma are two completely different metrics. When I want a fast read on what the market makers are pricing in, I come right into the option chain and look at-the-money.
Then I simply sell both the call side and the put side. That quick move gives me the practical, real-world approximation of 1 standard deviation. It’s not theoretical — it’s what the market itself is saying.
For example, when I pulled this up recently on S&P 500 index options (SPX), the calculation showed roughly $27 to $29 for 1 standard deviation. Now, I’ll be honest with you — this method is easy, quick, dirty, rough and sometimes a little bit inaccurate.
But it gets me in the ballpark fast.
Last summer I put this approach through a lot of testing, tracking the outcomes day after day. The goal was simple: Target around 1% gain a day. That kind of steady, incremental progress told me more about the reliability of the setup than any academic backtest ever could.
How Trading Platforms Calculate the Numbers
More sophisticated platforms like TastyTrade take this further. They use fancier algorithms to draw in lines showing approximately where 1 standard deviation is.
You’ll see visual representations with green highlighting and blue lines marking the 1-sigma levels.
These calculations don’t always perfectly align with my rudimentary method, and that difference actually reveals market inefficiencies. And here’s where strategy really matters.
You only have to be right for a short duration of time, which means you can manage risk with precision. On the outlier days, you can simply decide it’s not the right moment to take the trade. That flexibility — choosing not to engage when the risk profile shifts — is part of what gives this approach its durability.
The platform also provides lines for 2 standard deviations. For 3 standard deviations, which is where I like to trade, there’s no line drawn, so I calculate it by measuring the distance from 1- to to 2-sigma moves and extend that same distance again.
Over time, I learned the importance of sticking to my own rule: Always trade at 3 standard deviations. Treating it as a suggestion instead of a rule cost me big time early on.
When I finally committed to that discipline, one of my accounts went an entire stretch without a single loss. That experience cemented why the rule exists in the first place, and I do not push my luck anymore.
The platform also accounts for skew in its calculations. That’s why you might see slightly more strikes to the downside than upside — the actual standard deviation may not be a true bell curve on any given day.
The Probability Metrics I Actually Use
When it comes to evaluating these trades, I can filter by probability of profit (POP), and I like to stay above the 99% level for my 3-sigma trades. The platform also gives me options to look at out-of-the-money (OTM) percentage, touch percentage and in-the-money (ITM) percentage as different ways to evaluate the probabilities.
I prefer using the POP number as my primary metric — I rely on it heavily. It’s the number I trust most when I’m making my entry decisions.
One more thing worth noting: The delta usually hangs around 0.03 where I enter my trade. And as you get later in the day, all these probability numbers contract closer to the current price as time decay accelerates.
Look, I’m not talking about calculating 3 sigma of a price chart using some textbook formula. I’m talking about what the market makers are pricing in as 1 standard deviation — what the actual market is telling me right now.
That’s the difference between academic theory and practical trading. I’m watching what the market is pricing, not what a formula says it should be.
P.S. I’m going to show everyone how I trade a strategy around this exact market window at 7 p.m. ET on Sunday. If it sounds interesting to you, please don’t hesitate to save a seat and join us!
Jeffry Turnmire
Jeffry Turnmire Trading
I host my Morning Monster livestream at 9:15 a.m. ET each weekday on YouTube, and then 30 Minutes of Awesome at 5 p.m. ET each Tuesday!
Please check out my channel and hit that Subscribe button!
You can also follow along and join the conversation for real-time analysis, trade ideas, market insights and more!
- Telegram:https://t.me/+6TdDE7-F6GlhMmJh
Important Note: No one from the ProsperityPub team or Jeffry Turnmire Trading will ever message you directly on Telegram.
I’m just a regular dude in Knoxville, Tennessee: a husband, father, civil engineer, urban farmer, maker and trader.
I’ve been at this trading thing with real money for 20-plus years, and started paper trading over 35 years ago. I have a knack for making some epic predictions that just may very well come true. Why share them? Because I like helping other people — it’s the Eagle Scout in me.
*This is for informational and educational purposes only. There is inherent risk in trading, so trade at your own risk.
P.S. What Happens 2 Hours Before the Close?
There are no guarantees when it comes to trading…
Virtually anything can happen. You know this, I know this, we all know this…
One tragic event…
One earthquake…
One wrongly launched missile strike could trigger a cataclysmic event that could crush even the most stable stock.
But then, in one small corner of the market…
I’ve found a pattern that’s repeated every single day, no matter what, for at least two decades.
It didn’t matter who sat in the White House…
Or what our foreign policy was…
Or what new evil gimmick the deep pockets on Wall Street were up to.
This little-known pattern has played out two hours before the close, every single time.
Seven months ago, I began trying out a new approach to playing this pattern for a shot at a 1% payout per day.
The result?
A 100% win rate on more than 172 trades so far.
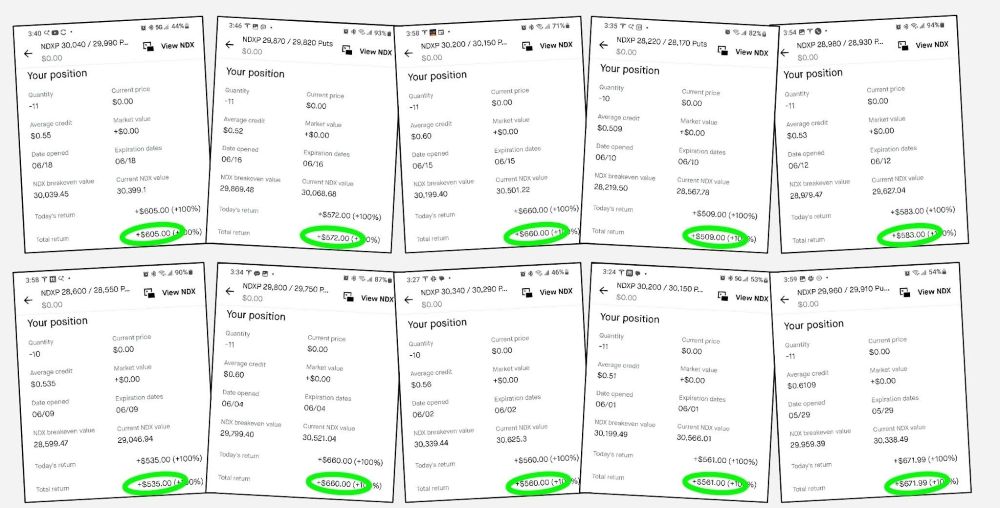
[ON A $10K STARTING STAKE]
The question now is…
Would you like to get on the same path with me?
Yes? Then you’re in luck.
Because right after celebrating our nation’s independence this Saturday…
I’ll be going live on July 5 to point you in the right direction of your own Income Independence.
Of course, I can’t make trading guarantees here, but…
We develop tools and strategies to the best of our ability but no one can guarantee the future.There is always a risk of loss when trading, and past performance is not indicative of future results. From 10/9/25 – 6/29/26 on 172 live trades taken with real money, the win rate is 100%, 1.04% average return, with an average hold time of less than 2 hours.