🚨 I’ll be live at 11:30 a.m. ET with Jack Carter🚨
We’ll share the report with today’s top Triple Income Strategy trades, break down the setups, discuss what’s moving markets and more [tap to join us for Market Masters]!
There’s a rhythm to earnings season that most traders miss, but once you see it, you can’t unsee it.
Over the next couple of weeks, we’re heading into one of those predictable capital flow patterns I’ve tracked for years. Money typically flows into Financials (XLF) first because banks report first, stays there for about a week to a week and a half, then rotates out and into big Tech (XLF) as their earnings approach.
This isn’t some random market shuffle — it’s a systematic pattern that plays out quarter after quarter, year after year. And right now, we’re at the beginning of that cycle.
Financial earnings kick off the week of April 13, which means next week should see capital positioning in that sector. Then, as those reports wrap up, that money doesn’t just sit idle…
It rotates into the tech names that report later in the month.
The Big Tech Earnings Calendar You Need to Know
Here’s where things get interesting on the tech side.
Amazon (AMZN) reports earnings on April 23, followed by Tesla (TSLA) on the 28th, and Apple (AAPL) on the 30th. That’s a heavy concentration of mega-cap names all reporting within about a week.
The typical flow works like this: Money into financials, out of financials and into big tech, then out of big tech and dispersed throughout the broader market. It’s a wave pattern, and understanding where you are in that wave can help you position rather than chase.
But this quarter has some additional wrinkles that make things more complex than usual.
The Buyback Blackout Factor
Here’s something that often gets overlooked: All these S&P 500 companies are in their buyback blackout periods right now, which means they can’t buy their own stock. This is a self-policing measure companies use to avoid any appearance of insider trading ahead of earnings.
When corporate buyback desks go dark, that’s significant demand that temporarily disappears from the market. It can create more volatility and less support than you’d normally see.
So you’ve got two opposing forces — retirement inflows providing support while corporate buybacks are sidelined. It creates an interesting situation, one that opens the door for some unexpected moves.
And there’s a broader backdrop influencing all of this. When the world dumps America’s debt, the borrowing costs explode. And this is not just some sort of abstract Wall Street problem here. It filters into equities, credit, energy prices and even day-to-day liquidity conditions.
That global layer matters because sector flows don’t exist in a vacuum. They interact with the macro environment, especially when major buyers or sellers of U.S. debt shift their posture.
At the sector level, there are places outside the usual financials-to-tech rotation where opportunity exists. If you know how to play the defense sector — we’re not talking about missiles and bombs but rather energy and short-term floating rates — you could make a killing here.
These areas often benefit when global pressure affects borrowing costs or commodity demand.
For traders looking at contrarian setups, there’s also movement worth noting in gold. Some major holders have been unloading reserves to raise cash, creating a short-term flush in prices.
When selling is driven by liquidity needs rather than fundamentals, it can set up attractive entries for anyone watching closely.
The key is staying aware of these dynamics rather than getting caught flat-footed. Watch how financials behave over the next week, then pay attention to whether that capital actually rotates into tech as expected. If the pattern holds, great. If it breaks, that tells you something important about market structure.
Either way, knowing what typically happens gives you an edge in understanding what you’re actually seeing unfold.
Jeffry Turnmire
Jeffry Turnmire Trading
I host my Morning Monster livestream at 9:15 a.m. ET each weekday on YouTube, and then 30 Minutes of Awesome at 5 p.m. ET each Tuesday!
Please check out my channel and hit that Subscribe button!
You can also follow along and join the conversation for real-time analysis, trade ideas, market insights and more!
- Telegram:https://t.me/+6TdDE7-F6GlhMmJh
Important Note: No one from the ProsperityPub team or Jeffry Turnmire Trading will ever message you directly on Telegram.
I’m just a regular dude in Knoxville, Tennessee: a husband, father, civil engineer, urban farmer, maker and trader.
I’ve been at this trading thing with real money for 20-plus years, and started paper trading over 35 years ago. I have a knack for making some epic predictions that just may very well come true. Why share them? Because I like helping other people — it’s the Eagle Scout in me.
*This is for informational and educational purposes only. There is inherent risk in trading, so trade at your own risk.
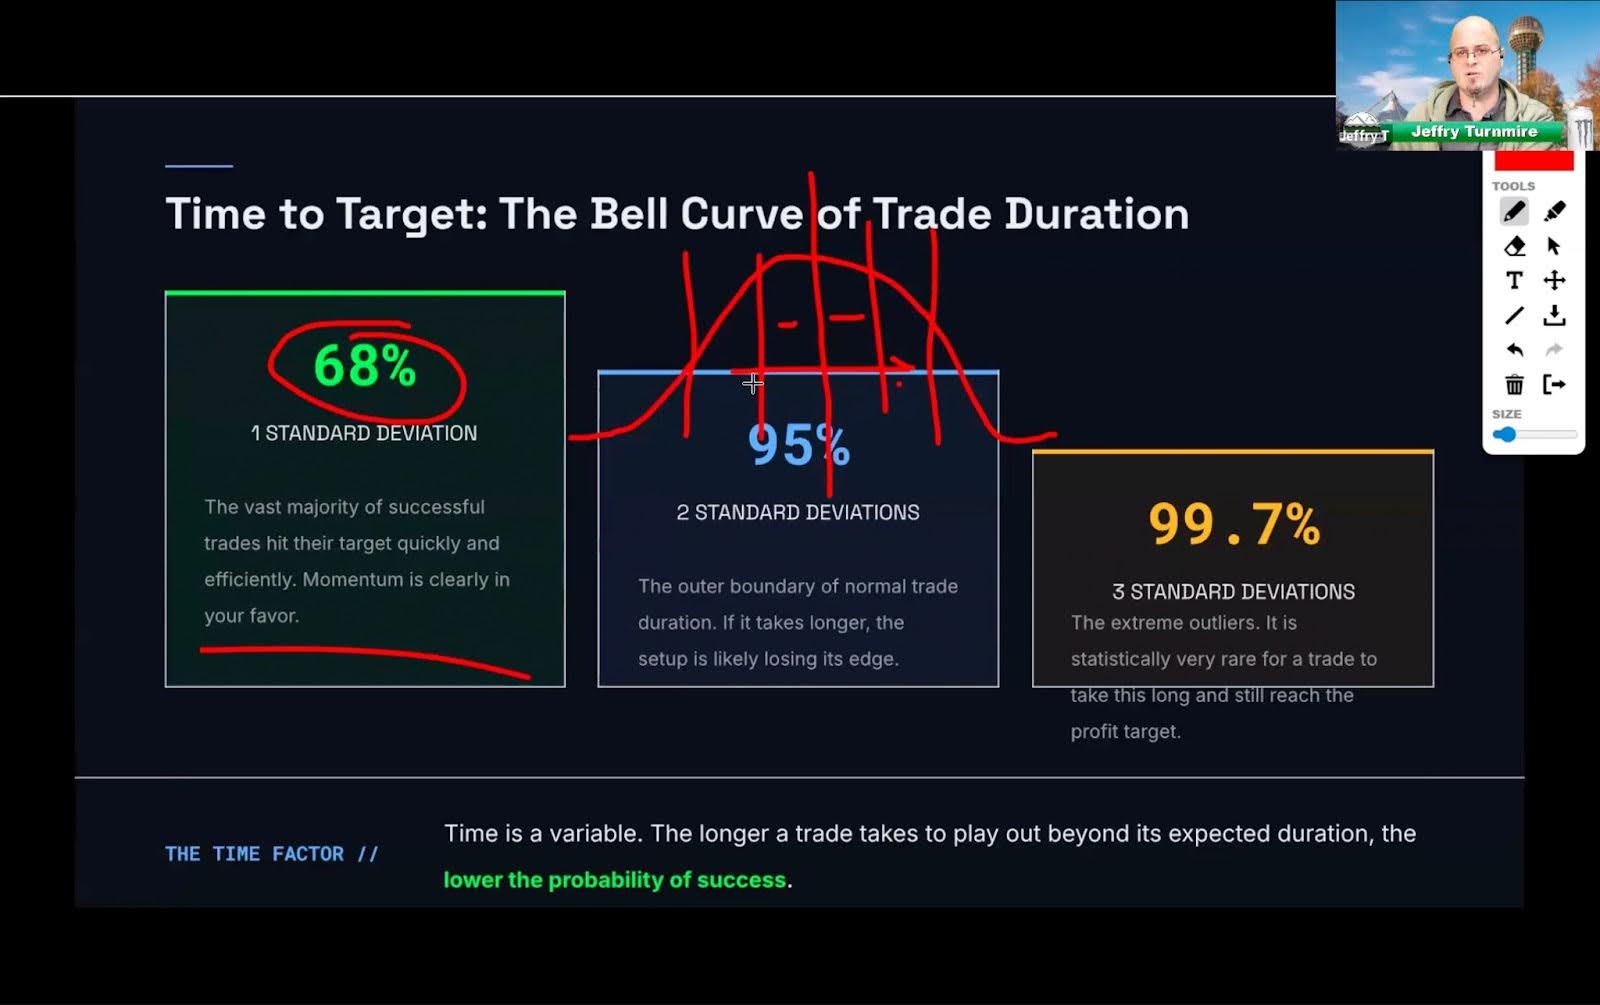
P.S. Have You Seen the 99.7% Historical Edge Backing My $50K Income Challenge?
You won’t believe how straightforward it is to grow a small account consistently using just one trade a day.
Leveraging this one-sided statistical pattern helped me double my trading account over the last year…
And now I’m revealing all the details behind it and more…
We develop tools and strategies to the best of our ability but no one can guarantee the future. There is always a risk of loss when trading. Past Performance is not indicative of future results. My $50k Challenge is a personal challenge to target $50,000 in trading revenue per month. In order to meet my personal challenge, I am starting with an account balance of $116,000. My goal is to grow this account to $1,600,000.00 over the course of time and make $50,0000 per month in trading revenue. Naturally, smaller accounts would take much longer to grow to that level and success…. and success is of course not guaranteed.