🚨 I’ll be live at 11:30 a.m. ET with Jack Carter🚨
Is the measured bounce for Tesla still valid, which of the top 5 stocks would Jack pick as far as risk-reward, how to run the triple income strategy with an account size under $10K, and how to handle assignment without panicking [tap to join us for Market Masters]!
Sometimes the market gives you exactly what you’re expecting, and this is one of those times.
I’ve been watching Nvidia (NVDA) complete a textbook ABC corrective pattern, and I’ve been talking about this setup for a good long while now on my Morning Monster stream (weekdays at 9:15 a.m. ET!).
The structure has been clear for anyone willing to look beyond the hype — and now we’re heading into what could be the final leg down. The setup aligns with textbook Elliott Wave behavior, a respected method in technical analysis.
This pattern unfolded amid a broader market sentiment that was initially heavy on puts, leading to a surprising rally that caught many off guard.
Let me walk you through what I’m seeing and why I think we’re probably heading back to retest that breakout level around $115.
The Wave Structure That’s Been Building Since Late 2024
The A-wave down happened back in October, November and December of last year. That was your initial sell-off — nothing unusual about it. Classic corrective behavior after a big run.
Then came the B-wave rally, which topped out right before earnings. I called that move exactly what it was at the time — a bull crap retrace. But it sucked people back in, got them excited again and set up the next move.
Now we’re likely heading into the C-wave, which means a probable retest of that breakout level. Does it have to go down there?
No. But is it likely? Yeah, I think so. This reflects a common market tendency to challenge investor convictions at critical moments.
How the Market Screws Everybody — Again
Here’s what makes this whole setup even more interesting. The market was super heavy on puts during that initial sell-off. Then what happened? It went ripping higher and everybody thought we were going to break out.
Put buyers got sufficiently bummed out and the market got people back on calls. NVDA calls were crazy popular. Everyone was positioned for the moon shot.
And then the market did what it always does — it ripped the call buyers and screwed everybody.
This is the cruel reality of how markets work. They have a nasty habit of flushing out whoever has the most conviction at exactly the wrong time. First the put buyers get burned, then the call buyers get wrecked. Rinse and repeat.
So where does that leave us now? With a setup that’s been telegraphing this move for weeks and a price structure that suggests we’re not done going lower yet. I’m watching for that retest around $115, which would complete the pattern and give us a much clearer picture of what comes next.
Let’s be careful out there. This isn’t the time to be a hero.
Jeffry Turnmire
Jeffry Turnmire Trading
I host my Morning Monster livestream at 9:15 a.m. ET each weekday on YouTube, and then 30 Minutes of Awesome at 5 p.m. ET each Tuesday!
Please check out my channel and hit that Subscribe button!
You can also follow along and join the conversation for real-time analysis, trade ideas, market insights and more!
- Telegram:https://t.me/+6TdDE7-F6GlhMmJh
Important Note: No one from the ProsperityPub team or Jeffry Turnmire Trading will ever message you directly on Telegram.
I’m just a regular dude in Knoxville, Tennessee: a husband, father, civil engineer, urban farmer, maker and trader.
I’ve been at this trading thing with real money for 20-plus years, and started paper trading over 35 years ago. I have a knack for making some epic predictions that just may very well come true. Why share them? Because I like helping other people — it’s the Eagle Scout in me.
*This is for informational and educational purposes only. There is inherent risk in trading, so trade at your own risk.
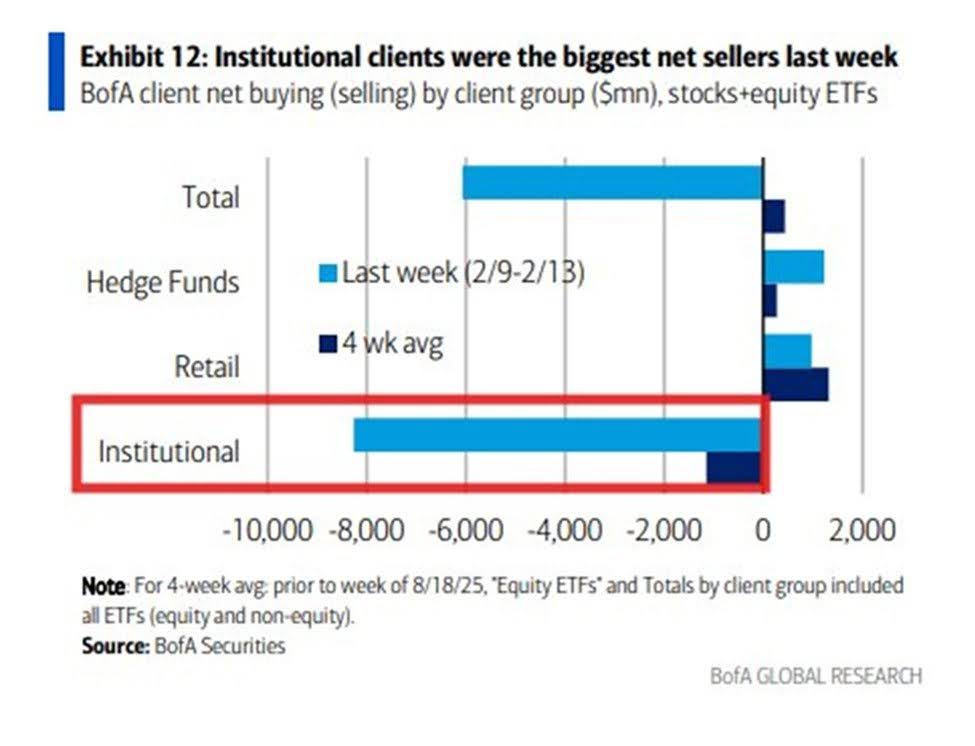
P.S. Wall Street’s Selling While Retail Is Buying — Are You Watching?
My take? Approach the market with caution over the next month or so.
Your setup should be one that doesn’t keep you stuck in the market for days on end — and I’ve got one just like that you should see here…
Check This Out Before It’s Gone!
We develop tools and strategies to the best of our ability, but no one can guarantee the future. There is always a risk of loss when trading past performance is not indicative of future results. From 7/10/24 – 2/20/26 the result was a 74% win rate with an average hold time of less than 24 hours on the underlying stock.