Last month, Jeffry posted an eye-popping chart in his Discord channel:
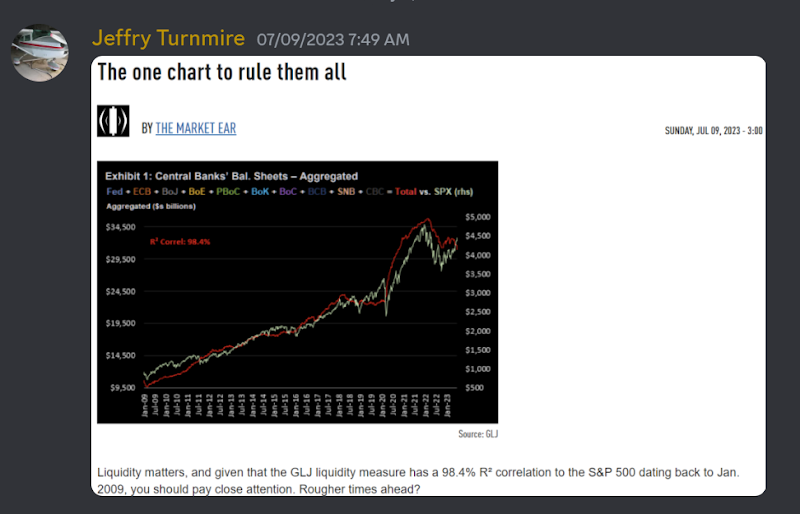
Here’s a closer look at that chart:
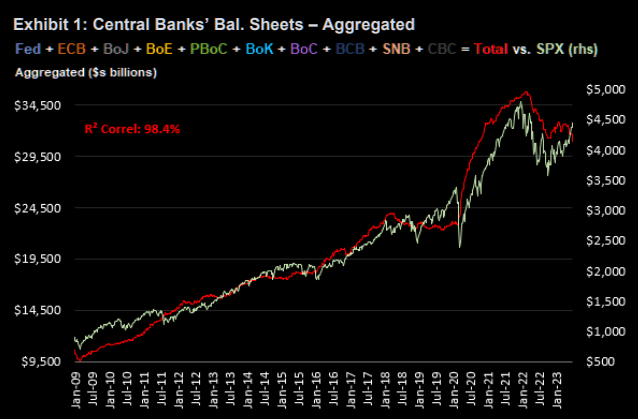
In short, when central banks print money, the S&P goes up.
And when they tighten their belts, it goes down.
UPDATE:
To build on the above point, he recently posted this chart in one of our internal chat channels:
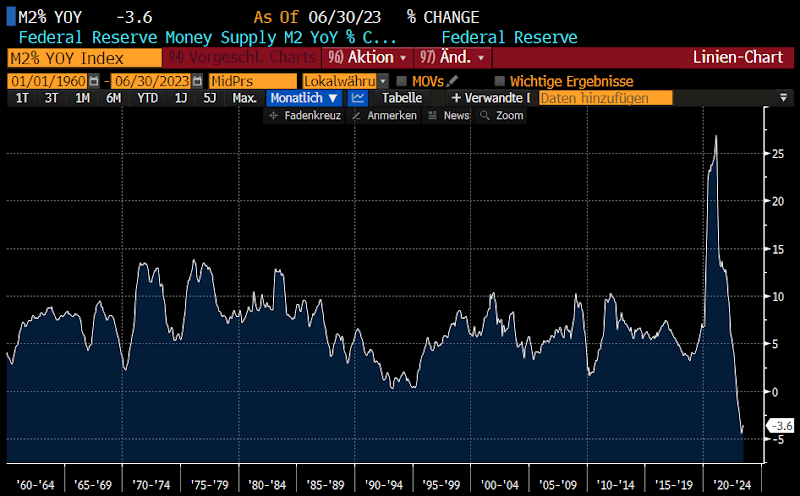
It’s a chart showing the Federal Reserve’s M2 Money Supply. See that sharp drop on the right?
No, your monitor isn’t cracked. That’s a dramatic plunge in the amount of available “M2” money.
And as we know from the first chart when liquidity drops, markets drop.
Could this be (part of) the reason for the market correction we’ve been seeing?
Now the only question is why are we all sitting here going cross-eyed looking at charts all day when we could just “follow the money” and trade accordingly?
Well, believe it or not, for some of us this is fun. (yes, we know we need help)
But secondly, this is obviously a big picture view. If you want to know where NVDA is headed next week, it’s not going to help you much…
Still, it’s worth looking for a long term perspective on where markets could be headed.
Jeffry actually mentioned this chart a few weeks ago on Ask The Pros.
Tune in at around 18 minutes 30 seconds to hear Garrett Baldwin talking about liquidity expansion continuing into 2026, when Jeffry chimes in with details about this chart.
Garrett makes some great points, so consider listening to the whole episode. It was chock full of great info.
Enjoy and trade safe!
— The Prosperity Pub Team