🚨 Market Masters is off today🚨
But Roger Scott is live at noon ET in his VIP Trade Room to analyze markets and internals, and discuss reversion trades, trend trades and more [tap to join him]!
Every so often, you’ll see stocks shoot up, creating what’s called the “bubble pattern.”
It’s a classic and I’ve seen it play out countless times in stocks like Nvidia (NVDA) and Tesla (TSLA). The psychology behind these moves is predictable, yet it pulls in new investors every time.
People get excited, thinking they’re on the ground floor of something big, and they don’t want to miss out. But here’s the truth: Bubbles always come to an end.
And if you’re not cautious, you could get burned.
So how do you spot the bubble? Well, it looks like this…

Watch for a quick, aggressive run-up — that’s the start of the hype cycle. Everyone and their grandmother starts talking about it. It doesn’t matter if it’s a high-profile stock or something obscure that suddenly seems to be “the next big thing.”
The excitement builds up, creating a euphoric top, and people buy in at what they think is just the beginning.
Reality Check and the Big Drop
But let’s talk about reality…
That initial run-up is usually followed by consolidation — a stall where prices level out. Then comes the scary part: the big drop. Some people panic and sell, while others convince themselves that they’re holding through a “small correction” before it goes even higher.
But what often follows is a full breakdown.
Look, Nvidia is a perfect example. Right now, it’s still riding the AI hype, pushing higher with every news cycle. But when that hype fades — and it will — we’ll likely see a pullback, maybe even a substantial one.
Tesla went through a similar cycle, with wild ups and downs that left people scrambling to catch up. This pattern isn’t unique to these stocks — it’s a common theme in market psychology.
But isn’t it possible they could keep going up?
Sure, it’s possible. But the safer bet is to expect a retrace, sometimes as much as 60% or 70%. Those zones aren’t magic, either — they’re just where the consolidation was. If you don’t understand these levels, it’s easy to get caught off guard.
For newer traders, the best advice is to watch and wait for that retrace. Don’t let FOMO — fear of missing out — get the better of you. If a stock is at an all-time high and the hype is through the roof, remember that what goes up can, and often does, come down.
Wait for the bubble pattern to play out… Patience will save you from paying too much.
When a stock’s chart starts looking like a bubble, resist the urge to jump in. Most of the time, you’re better off waiting for the pattern to come full circle. And if you’re already in, keep your exit plan ready.
Because when the hype dies down, and the real value kicks in, you’ll be glad you didn’t get swept away with everyone else.
Jeffry Turnmire
Jeffry Turnmire Trading
I host my Morning Monster livestream at 9:15 a.m. ET each weekday on YouTube, and then 30 Minutes of Awesome at 5 p.m. ET each Tuesday!
Please check out my channel and hit that Subscribe button!
You can also follow along and join the conversation for real-time analysis, trade ideas, market insights and more!
- Telegram:https://t.me/+6TdDE7-F6GlhMmJh
Important Note: No one from the ProsperityPub team or Jeffry Turnmire Trading will ever message you directly on Telegram.
I’m just a regular dude in Knoxville, Tennessee: a husband, father, civil engineer, urban farmer, maker and trader.
I’ve been at this trading thing with real money for 20-plus years, and started paper trading over 35 years ago. I have a knack for making some epic predictions that just may very well come true. Why share them? Because I like helping other people — it’s the Eagle Scout in me.
*This is for informational and educational purposes only. There is inherent risk in trading, so trade at your own risk.
P.S. Have You Seen the 99.7% Historical Edge Backing My $50K Income Challenge?
You won’t believe how straightforward it is to grow a small account consistently using just one trade a day.
Leveraging this one-sided statistical pattern helped me double my trading account over the last year…
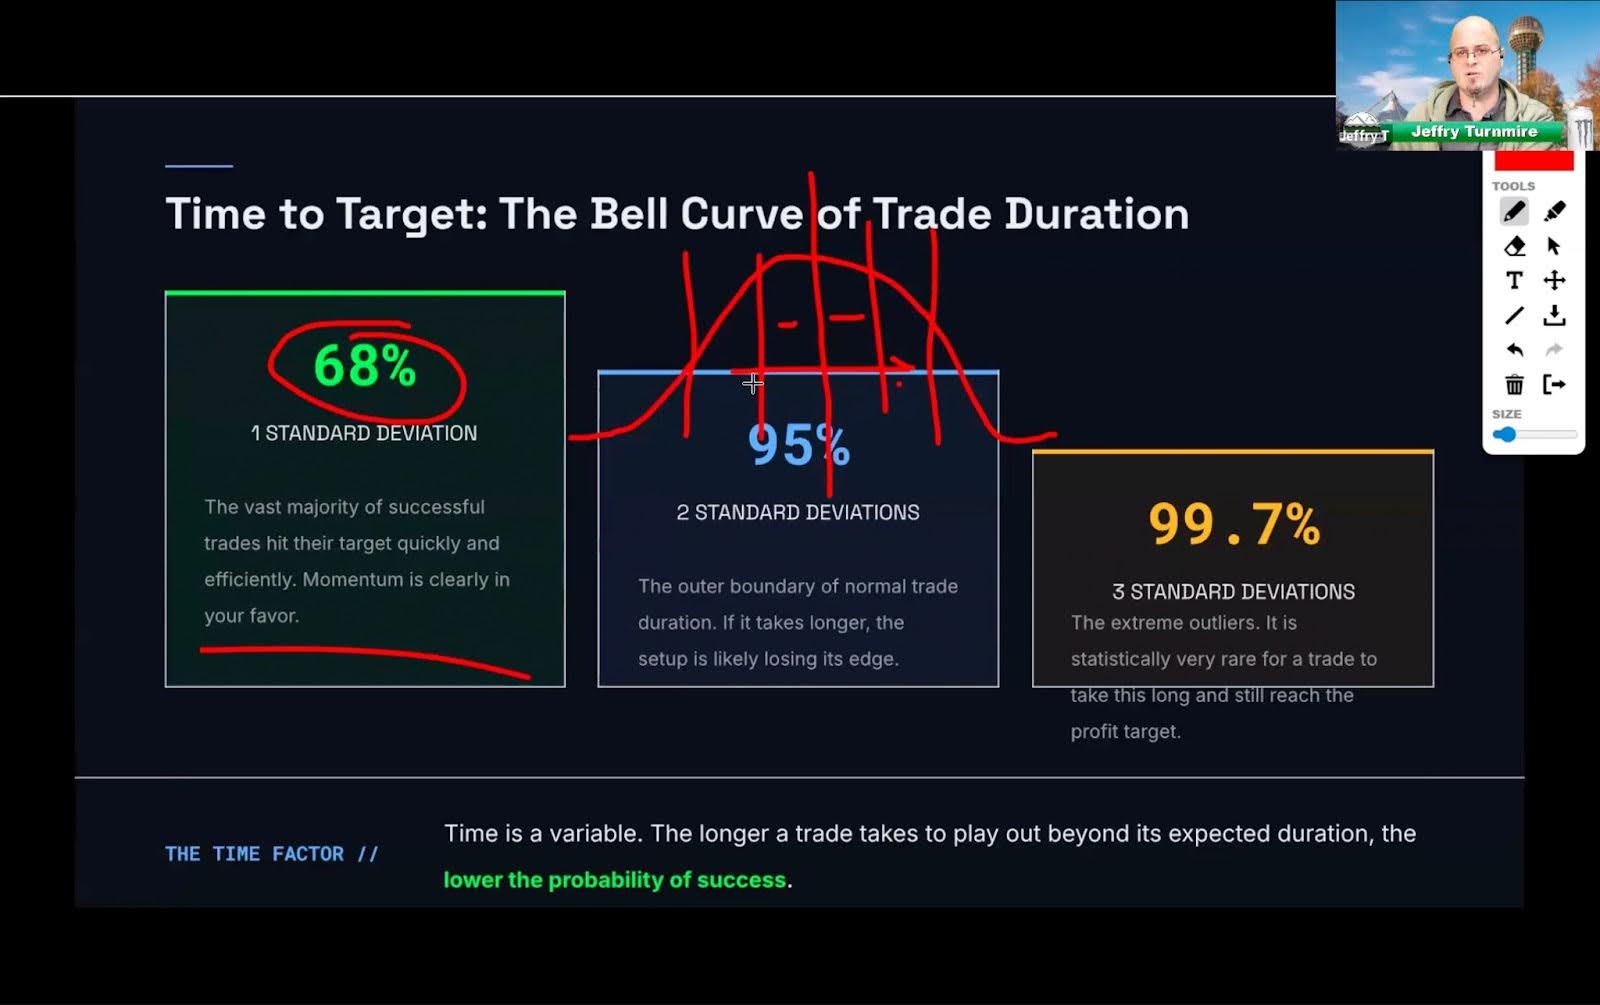
And now I’m revealing all the details behind it and more…
We develop tools and strategies to the best of our ability but no one can guarantee the future. There is always a risk of loss when trading. Past Performance is not indicative of future results. My $50k Challenge is a personal challenge to target $50,000 in trading revenue per month. In order to meet my personal challenge, I am starting with an account balance of $116,000. My goal is to grow this account to $1,600,000.00 over the course of time and make $50,0000 per month in trading revenue. Naturally, smaller accounts would take much longer to grow to that level and success…. and success is of course not guaranteed.