🚨 I’ll be live at 11:30 a.m.🚨
Step inside the live Zoom room now to see the rare chart pattern — identical to the one that preceded the 2020 crash — that could signal a “Greater Depression” or a massive profit window as the oil crisis and Iran conflict accelerate [tap to join us]!
I know gold has been getting hammered lately, and there’s a good reason for it.
Turkey and Russia have both been dumping gold to raise cash, which has created a short-term purge and plunge in the price. Turkey alone dumped $22 billion in foreign government securities, mostly U.S. Treasurys — and then liquidated 58 tons of gold since the war started.
That kind of heavy selling is going to distort the market temporarily.
But here’s the bigger point: This selling pressure will run its course. And when you zoom out, the backdrop becomes even more compelling. The U.S. is running a $2 trillion deficit while fighting a war we can’t really afford, and struggling to sell debt at the same time.
Foreign ownership of U.S. Treasurys has dropped 32.4%, the lowest level since 1997. That tells you a lot about how the world views U.S. debt right now.
With foreign central banks dumping U.S. debt to fund their own survival, the correlation between oil, bonds and stocks is not like what it used to be. Everything is shifting.
Inflation is also likely to stay more persistent than people want to admit, and the structural demand for a non-fiat store of value could come roaring back once this shakeout ends.
The Technical Picture: One More Flush Expected
Before you rush in, timing matters. I’m expecting one more flush lower to complete this correction. There’s a key level on gold to watch — as long as we stay under it, there’s still downward pressure for one more move lower.
The structure of this pullback suggests it hasn’t taken long enough to fully correct yet. If we break above that resistance, the downside might be off for now — but I’m not convinced we’re done on the bottom just yet.
This uncertainty is why some traders are looking at plays like ProShares Ultrashort 20-Plus-Year Treasury ETF (TBT). If yields are rising, bond prices are falling, so TBT is a direct bet against longdated bonds as the government struggles to find buyers.
It’s one way to approach this environment while waiting on the gold setup to finalize.
The Miners to Watch: Newmont, Barrick and Ashanti
Buying the dip in gold miners might be wise but again, timing is everything. Not all miners are positioned the same way coming out of this correction.
Newmont Mining (NEM) and Barrick (B) stand out as some of the strongest setups. Both have a clean three-wave bounce pattern that could already be complete.
These two could push above key resistance, pull back during the next gold flush and then continue higher — potentially outperforming the broader miner space.
Ashanti Gold (AU) looks like it may still need a lower low based on its current pattern. It’s not a bad setup but the entry likely requires more patience.
And for those thinking about leveraged miners like MicroSectors Gold Miners 3x Leveraged ETN (GDXU)… be careful.
I’m still not convinced gold has found its final bottom for this cycle, and 3x leverage cuts both ways.
The macro setup is building. The structural pressures are shifting. The washout looks close to complete. But being patient and precise with your entries here could be the difference between catching the flush or catching the rally.
Jeffry Turnmire
Jeffry Turnmire Trading
I host my Morning Monster livestream at 9:15 a.m. ET each weekday on YouTube, and then 30 Minutes of Awesome at 5 p.m. ET each Tuesday!
Please check out my channel and hit that Subscribe button!
You can also follow along and join the conversation for real-time analysis, trade ideas, market insights and more!
- Telegram:https://t.me/+6TdDE7-F6GlhMmJh
Important Note: No one from the ProsperityPub team or Jeffry Turnmire Trading will ever message you directly on Telegram.
I’m just a regular dude in Knoxville, Tennessee: a husband, father, civil engineer, urban farmer, maker and trader.
I’ve been at this trading thing with real money for 20-plus years, and started paper trading over 35 years ago. I have a knack for making some epic predictions that just may very well come true. Why share them? Because I like helping other people — it’s the Eagle Scout in me.
*This is for informational and educational purposes only. There is inherent risk in trading, so trade at your own risk.
The Zoom room is open so step inside!
I’ll get straight to it…
Oil prices exploded overnight, and with Iran still choking off a fifth of the world’s energy supply by shutting down the Strait of Hormuz.
Things might get very choppy the next couple of days.
As you know, Trump went on national TV on Wednesday night saying this conflict is far from over.
But here’s what’s got my full attention right now…
There’s a chart pattern completing today that I’ve only seen a handful of times in my career.
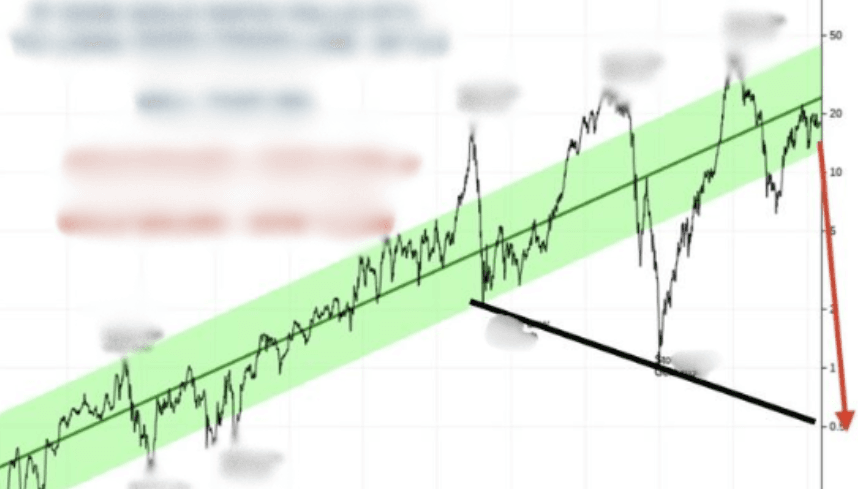
The last time it showed up? Early 2020… right before COVID crashed the market.
I recognized it, positioned myself and turned $250k into $1.4 million in under a month while most traders were frozen in shock.
That exact pattern is back.
And with everything happening in the Middle East right now — the oil crisis, the military escalation, the uncertainty — this setup could be even bigger than what we saw during COVID.
I’m not going to sugarcoat it.
I believe we could be heading into something that looks a lot like a “Greater Depression.”
While I cannot make any guarantees of future returns or against losses…
If I’m right, the next few weeks could either be devastating for your portfolio… or one of the biggest profit windows you’ll ever see.
It depends entirely on what you do right now.
That’s why I’m LIVE right now.
Walking through everything – the pattern, what it means, and exactly where I’m moving my money before this thing accelerates.
This isn’t something you want to catch the replay on…
Get inside the LIVE Zoom room before I get too deep in.