🚨 I’ll be live at 11:30 a.m. ET with Jack Carter🚨
We’ll share the report with today’s top Triple Income Strategy trades, break down the setups, discuss what’s moving markets and more [tap to join us for Market Masters]!
Sometimes the market doesn’t need a crystal ball — it just needs a history book.
I’ve been tracking something for years now that most traders have completely overlooked. It’s a pattern I first shared back in 2020, 2021 and 2022, and it’s playing out almost perfectly right now.
The setup is eerily familiar if you know where to look.
We could be watching a replay of the 1970s inflation cycle, and we’re right at the most dangerous part — the moment that everyone thinks the worst is over. That “premature all clear” is exactly what happened before inflation came roaring back with a vengeance last time around.
And we humans love to repeat patterns…
Here’s what has my attention: this whole cycle kicked off in May 2020 when we flooded the economy with cheap dollars and stimulus. Sound familiar? That spike in inflation followed the same script as the late 1960s.
Now here’s where it gets interesting. We’re 72 months later from that initial stimulus spike, crossing into May 2026 — and if you overlay the 1970s chart, that’s precisely when inflation started ticking back up after everyone called it contained.
Why History Might Be About to Repeat
Look, I wasn’t around in the 1960s, but I can read the numbers. I can study the history. And what I see is a pattern that humans love to repeat.
Sure, we’re blaming current price pressures on geopolitical events and supply chains. But this has all been cooking beneath the surface. Recently, Iranian drones and missiles slammed into two of the world’s biggest aluminum smelters in the UAE and Bahrain, tightening supply chains in ways that ripple across commodity markets. Events like that pile onto an already stressed system.
Add to that the fact that forecasts for inflationary pressures are rising again. One major bank warned that demand shocks are linear, but supply shocks are exponential — exactly the kind of imbalance that fueled previous inflation spikes.
If this pattern holds — and I’m not saying it will, but the similarities are striking — we could be looking at something significant. We’re looking at 125% going to 250% on the inflation index. That’s like a double on prices again. Everything going up 100% from where we are right now.
Think about that for a moment. If you thought the past few years were wild, imagine everything doubling from here.
The Timeline That Should Concern You
This isn’t an overnight scenario. The whole cycle to the top back in the 1970s took about 10 years. So we could actually see this ramp up with inflation and rates over the next decade.
What’s particularly interesting right now is watching the Fed’s positioning. They’re trying to hold steady, but market rates are pushing through their targets. The market is currently pricing at a 52% probability of a rate hike by the end of 2026, not a cut. Last time we saw this kind of disconnect, things got messy before they got better.
I’m not trying to scare anybody here. Just warning you what happens if we deja vu and do things we’ve done before. The pattern is there. The timing lines up. Now we watch to see if history rhymes once again.
The key is staying aware of these larger cycles while positioning accordingly. When everyone else is declaring victory over inflation, that’s exactly when you need to stay sharp.
Jeffry Turnmire
Jeffry Turnmire Trading
I host my Morning Monster livestream at 9:15 a.m. ET each weekday on YouTube, and then 30 Minutes of Awesome at 5 p.m. ET each Tuesday!
Please check out my channel and hit that Subscribe button!
You can also follow along and join the conversation for real-time analysis, trade ideas, market insights and more!
- Telegram:https://t.me/+6TdDE7-F6GlhMmJh
Important Note: No one from the ProsperityPub team or Jeffry Turnmire Trading will ever message you directly on Telegram.
I’m just a regular dude in Knoxville, Tennessee: a husband, father, civil engineer, urban farmer, maker and trader.
I’ve been at this trading thing with real money for 20-plus years, and started paper trading over 35 years ago. I have a knack for making some epic predictions that just may very well come true. Why share them? Because I like helping other people — it’s the Eagle Scout in me.
*This is for informational and educational purposes only. There is inherent risk in trading, so trade at your own risk.
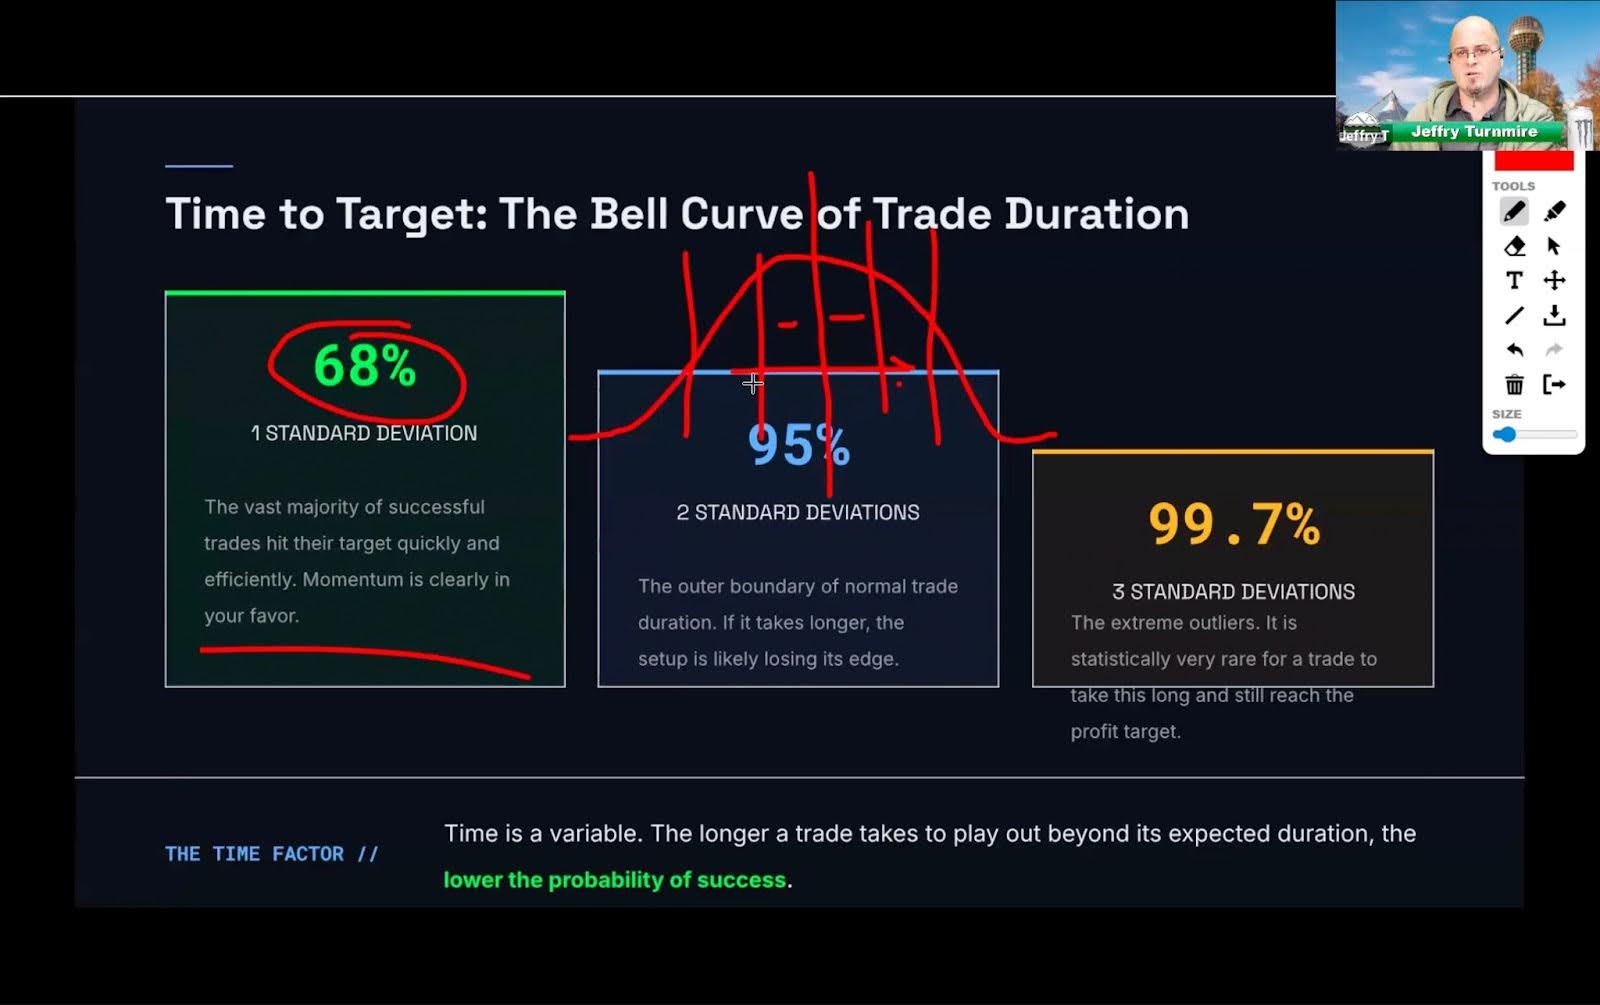
P.S. Have You Seen the 99.7% Historical Edge Backing My $50K Income Challenge?
You won’t believe how straightforward it is to grow a small account consistently using just one trade a day.
Leveraging this one-sided statistical pattern helped me double my trading account over the last year…
And now I’m revealing all the details behind it and more…
We develop tools and strategies to the best of our ability but no one can guarantee the future. There is always a risk of loss when trading. Past Performance is not indicative of future results. My $50k Challenge is a personal challenge to target $50,000 in trading revenue per month. In order to meet my personal challenge, I am starting with an account balance of $116,000. My goal is to grow this account to $1,600,000.00 over the course of time and make $50,0000 per month in trading revenue. Naturally, smaller accounts would take much longer to grow to that level and success…. and success is of course not guaranteed.