>>>Join Nate and I weekdays at 10 AM ET for Opening Playbook — we’ll cover the day’s most important, actionable trading opportunities and hot setups, education, strategies and more!<<<
I came across some research recently that stopped me in my tracks — and it’s one of those patterns that once you see it, you can’t unsee it.
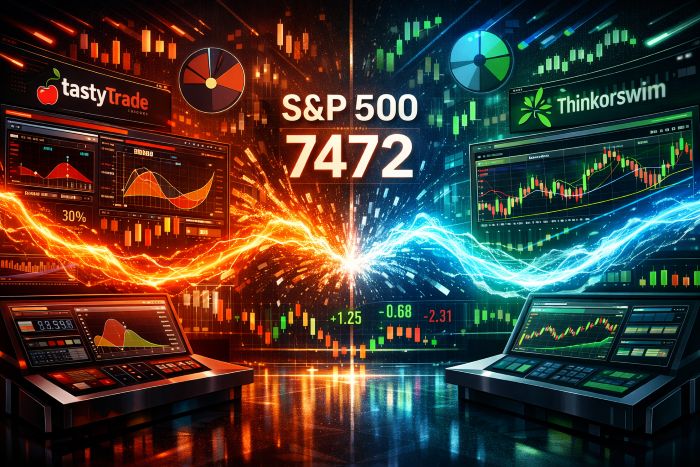
We’ve all seen the chart in the S&P 500 (SPX) where it goes up overnight and stalls during the day. That’s been documented for years now. But what caught my attention is that this same behavior is showing up in Bitcoin (BTC).
When you look at the iShares Bitcoin Trust (IBIT), the numbers are striking. After-hours performance is really good, buy and hold is fine, but intraday it’s bad. BTC typically pops overnight and fades during the day, just like SPX.
And this is where things get even more interesting, because the pattern doesn’t stop with equities and crypto. Gold — which you’d expect to behave completely differently — shows the same overnight tilt. All the gains are coming after hours, even though trading gold only after hours actually underperforms a simple buy-and-hold approach. There isn’t the same edge you see in SPX or BTC, but the pattern itself is unmistakable.
Even Gold Follows the Pattern
That raises an important question: why would three unrelated asset classes show the same return distribution? With stocks, you can point to earnings announcements, news releases and Fed statements — all of which tend to hit outside regular trading hours. BTC doesn’t have earnings, but there’s still a steady stream of headlines and catalysts that break overnight.
Gold is the outlier. It doesn’t rely on news or earnings, yet it still displays the same after-hours bias. That suggests something broader is happening here.
What’s Really Going On Here?
One possibility is global flow dynamics. Buying activity in Asia and China often aligns with U.S. after-hours trading, which could explain gold’s behavior and maybe some of BTC’s as well. But the bigger takeaway is that this pattern persists across equities, cryptocurrency and commodities. When markets that have nothing in common all show the same timing effect, it points to something systematic at work rather than isolated events or headline-driven moves.
Whether the cause is market structure, global liquidity cycles or something we haven’t fully identified yet, the consistency is what matters. As traders, recognizing these patterns — even when the underlying mechanism isn’t completely understood — can be incredibly valuable.
None of this means you should rush into an after-hours-only strategy across every asset class. But it does challenge some long-held assumptions about when markets truly move and whether traditional intraday participation captures the real drivers of returns.
Something to think about next time you’re watching the overnight action.
Graham Lindman
Graham Lindman Trading
Follow along and join the conversation for real-time analysis, trade ideas, market insights and more!
- Telegram:https://t.me/+abM5RWRJKrpkNWI5
- YouTube:https://www.youtube.com/@NewMoneyCrew
Important Note: No one from the ProsperityPub team or Graham Lindman Trading will ever contact you directly on Telegram.
*This is for informational and educational purposes only. There is inherent risk in trading, so trade at your own risk.
P.S. Other Traders Might Ignore a ‘Small’ Move Like This
Most traders assume you need big moves in stocks just to see decent profits.
But here’s the truth…
A strange quirk in how options are priced creates a rare sweet spot where even a boring 1% move on a stock can snowball into a 100% return on the right trade.
It sounds crazy. But it’s not theory, it’s math.
The “glitch” happens when market makers misprice contracts. They’ll never admit it publicly… but if you know how to look, you can spot it in real time.
And that’s exactly what I want to show you.
I found a way to automatically scan the entire market, flag these mispriced setups, and get in on clear, actionable trades.
The best part? These setups don’t require hours of chart analysis or guessing where the headlines will land.
They just require you to step in and execute before the window closes.
Naturally, no one can guarantee outcomes.
But if you want a shot at 100% ROI weeks from “nothing” stock moves…
We develop tools and strategies to the best of our ability, but no one can guarantee the future. There is always a risk of loss when trading. Past performance is not indicative of future results. From 10/05/23-12/3/25 the average return per trade winners and losers was 22.38% with an average winner of 91.51% and a 61.8% win rate over a 4-day hold time.