🚨 I’ll be live at 10 a.m. ET with Nate Tucci🚨
We have a special guest, Jeffry Turnmire, joining us for today’s action-packed show and more [tap to join us for Opening Playbook]!
There’s a chart I’ve been showing for weeks now that typically makes everyone’s eyes glaze over. Honestly, I’ve flown through the slide almost every time because there was just nothing happening — nothing worth discussing.
But over the last week, something changed. And it changed fast.
I’m talking about the investment grade credit spread — a measure of how confident investment banks feel about lending money. When this number is low, they’re confident in the economy.
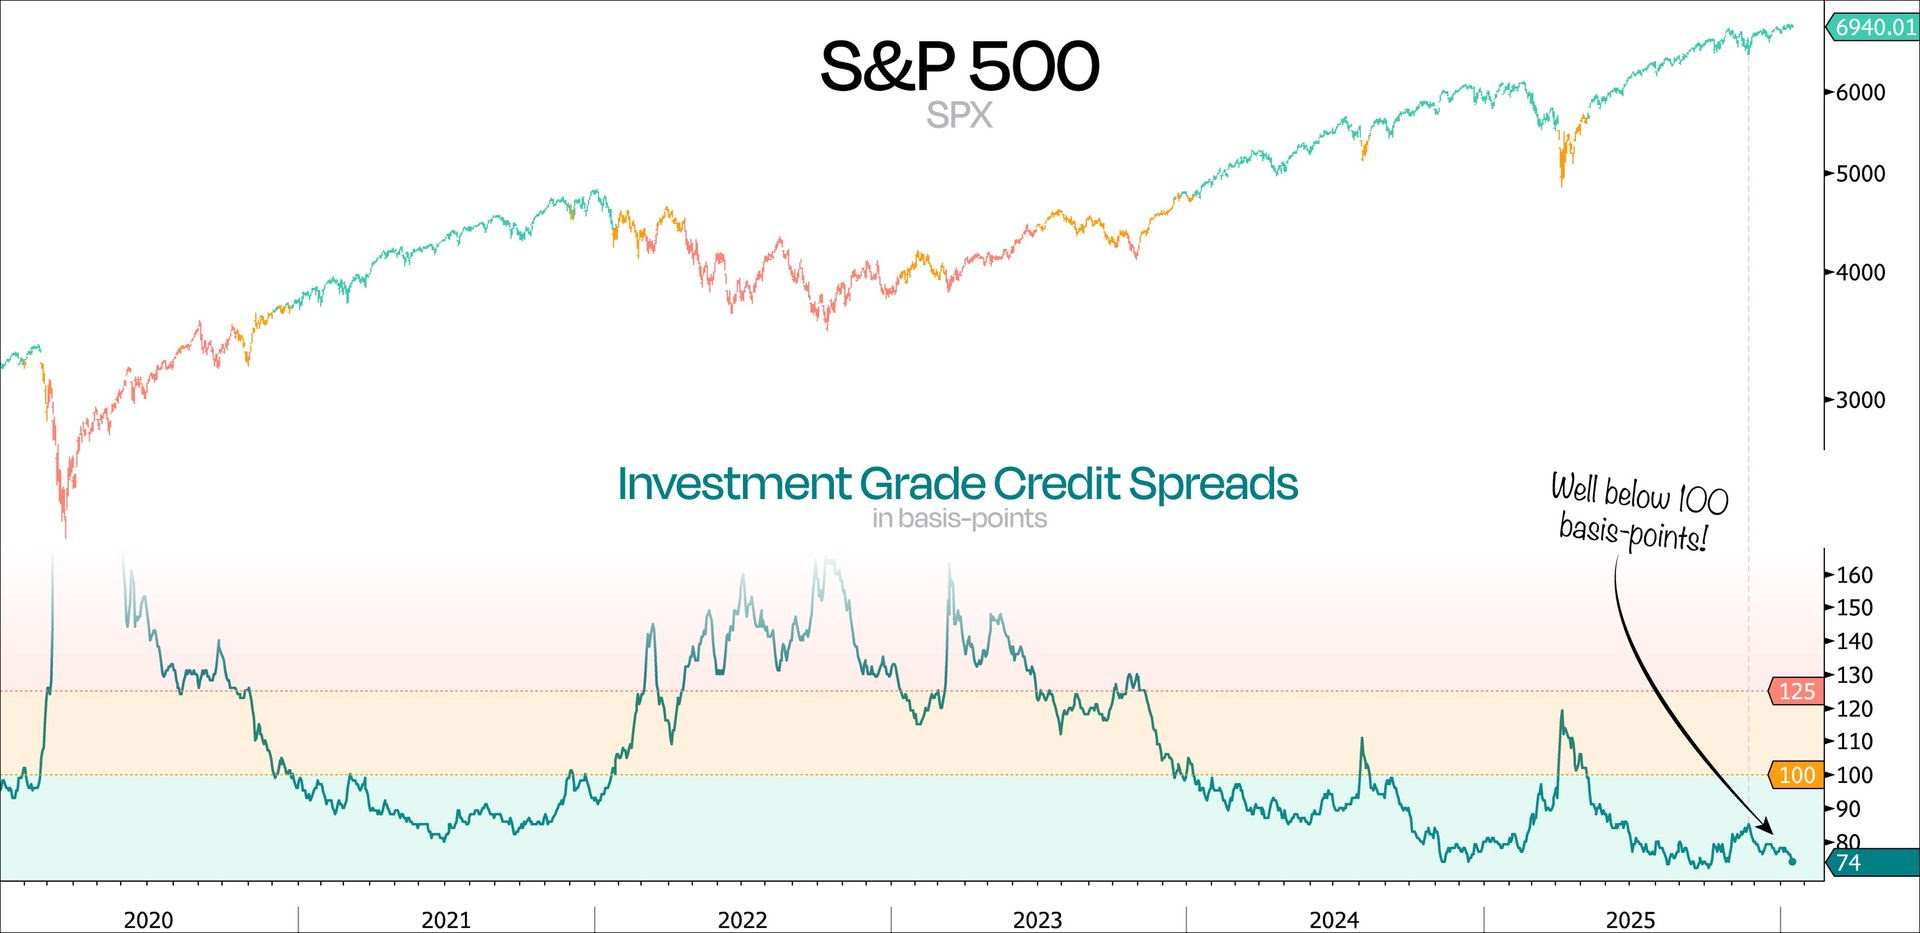
When it pops above 1, they start losing confidence. And above 1.25, it’s basically a risk-off signal — they don’t trust the market at all.
Here’s why this matters right now — we’re currently sitting around 0.94, and this thing has been spiking rapidly over the past week. That puts us dangerously close to that critical one threshold.
What adds to the urgency is how fast this indicator can move. I’ve seen it shoot from 0.9 to 1.2 in about a week and a half, giving almost no time to react once it starts accelerating.
When that happens, markets usually feel it — quickly.
Broader Market Sentiment
The credit spread isn’t the only thing catching my attention. The VIX is also giving me a bit of pause. And honestly, it’s not just the VIX — there are several things layering together right now that suggest the market may be more fragile than it appears on the surface. When multiple sentiment indicators start flashing at the same time, I pay close attention.
What History Tells Us About This Indicator
When I look back at the data, the pattern is crystal clear. The green periods — when the spread is below 1 — coincide with awesome market performance. Yellow periods — above 1 — show choppy below-average returns. And red periods — above 1.25 — typically precede major pullbacks.
What really gets my attention is how quickly this can shift. Even just the start of those yellow zones has historically been a good time to pull out. You might break even on your positions but you avoid the downside volatility that typically follows.
This could indicate a 10-20% dump coming — we’ve seen it happen over and over again.
Historical note: Some of the sharpest downside moves in recent years came right after rapid jumps in the credit spread, especially when the move happened in a compressed window. The speed of the shift often matters as much as the level itself.
Strategic Adjustments
Look, I know we’ve been talking about how seasonally this period is very, very bullish. If we stick to the seasonal trend, this should be an awesome buying opportunity. But this credit spread indicator is my big yellow flag right now — it has me overriding those seasonal patterns.
Why? Because it’s been so accurate so often. That doesn’t mean we’re walking into a full one-year bear market like 2022, but it does suggest we could see a sharp pullback — the kind that catches people off guard and wipes out short-term bullish setups.
So I’m adjusting. I’d rather sit in cash, wait for that potential flash, and then buy call options for a cleaner rip on the rebound. It’s simply a better risk-reward profile given how quickly this indicator can flip the script.
I’m setting up daily monitoring of this chart and posting updates because right now, if we pop above 1, it’s probably not good for the near term. This boring chart just became the most interesting — and most important — one I’m watching.
Keep your eyes on this level. The market might be telling us something we need to hear.
Graham Lindman
Graham Lindman Trading
Follow along and join the conversation for real-time analysis, trade ideas, market insights and more!
- Telegram:https://t.me/+abM5RWRJKrpkNWI5
- YouTube:https://www.youtube.com/@NewMoneyCrew
Important Note: No one from the ProsperityPub team or Graham Lindman Trading will ever contact you directly on Telegram.
*This is for informational and educational purposes only. There is inherent risk in trading, so trade at your own risk.
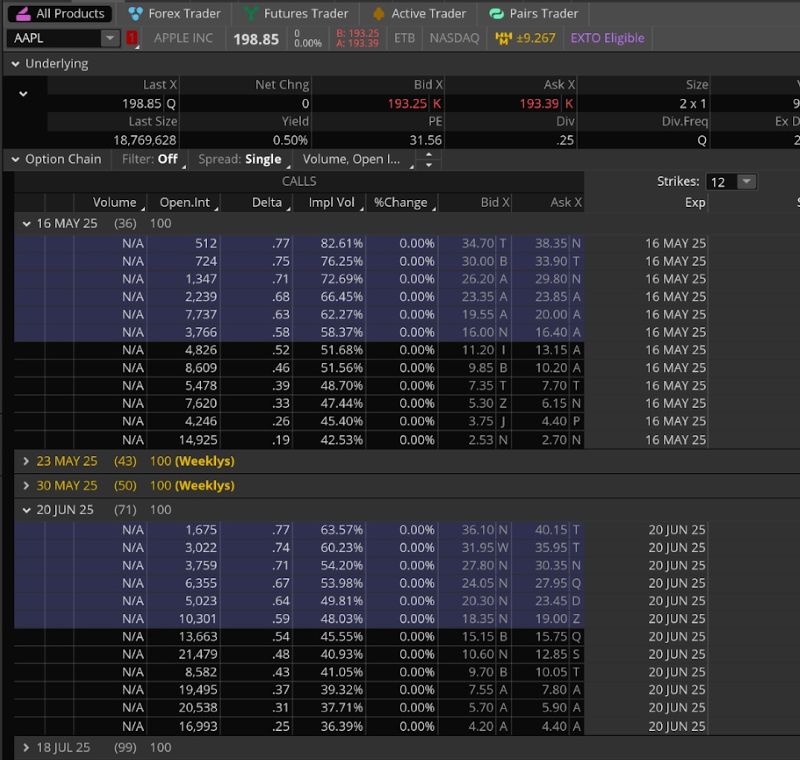
P.S. The Options Market Is Not as Efficient as You Think!
I just found a “glitch” in the way options are priced,,,
And I’ve been exploiting it for a shot at weekly payouts.
Want to see exactly how you can do the same?
We develop tools and strategies to the best of our ability, but no one can guarantee the future. There is always a risk of loss when trading past performance is not indicative of future results. From 10/05/23 through 30/01/26 the average return per trade winners and losers was 29.89% with an average winner of 92% and a 61% win rate over a four day hold time.