I’ll be honest — I don’t spend much time on the Dow. It’s usually a pretty boring index.
Most traders focus on the Nasdaq or the Russell 2000, and I get it. But right now, the Dow (DJI) is doing something that caught my attention in a big way.
The DJI just closed its eighth consecutive positive month. That might not sound earth-shattering at first, but here’s where it gets interesting: this pattern has only occurred eight times in the past 100 years.
When I dug into the historical data, the results were remarkable. Three months after this eight-month winning streak appeared, the DJI has gone higher 100% of the time. Six months later, it’s still 100% positive. Even a full year out, it maintains an 88% success rate.
That’s the kind of statistical edge you don’t ignore.
What makes this even more compelling is that the DJI hasn’t just been drifting higher — the strength behind the move has been undeniable. While it often sits in the shadow of flashier indices, this streak is forming on top of a trend that’s been consistently strong and technically clean, the kind of structure that rarely gets the attention it deserves.
The Dow Has Been Outperforming
What really stands out to me isn’t just the historical precedent — it’s how the DJI is actually performing relative to other indices right now. When I compare it to Invesco QQQ Trust (QQQ), the DJI chart looks cleaner and stronger.
QQQ’s momentum is curling down, showing weakness while the DJI is holding firm without any sign of bending until Wednesday’s dip, pushing into higher swing highs with confidence.
Most traders gravitate toward high-volatility names in tech-heavy indices, but the DJI has quietly been the stronger, steadier performer. Its trend structure is beautiful — a smooth, uninterrupted climb that says more about underlying market conviction than most people realize.
When you put it side by side with QQQ, the contrast is obvious. The DJI simply looks better.
For an index that rarely gets attention, it’s displaying a level of strength that’s hard to dismiss. And sometimes the market’s most telling signals come from the places traders overlook because they assume the action is happening elsewhere.
Why This Matters for Your Trading
I’m not saying you need to start day-trading DJI components right now, but this setup suggests it may continue to outperform over the next few months, and that has broader implications.
When the DJI leads, it often signals strength in more traditional value-oriented sectors. It can indicate a rotation in market leadership that creates opportunities beyond the usual tech darlings — opportunities that reward traders who pay attention to shifts before they become obvious.
The data doesn’t lie. An eight-month winning streak with a 100% historical success rate over the next three to six months isn’t something that happens often, and when it does, it pays to notice.
The DJI might be boring most of the time, but right now, it’s telling us something worth listening to.
Graham Lindman
Graham Lindman Trading
Follow along and join the conversation for real-time analysis, trade ideas, market insights and more!
- Telegram:https://t.me/+abM5RWRJKrpkNWI5
- YouTube:https://www.youtube.com/@NewMoneyCrew
Important Note: No one from the ProsperityPub team or Graham Lindman Trading will ever contact you directly on Telegram.
*This is for informational and educational purposes only. There is inherent risk in trading, so trade at your own risk.
P.S. How to Target Weekly Tesla Payouts No Matter What Happens
It’s already agreed that I’m bullish on Tesla.
But knowing the market, anything can happen, and nothing is guaranteed.
So while I’m expecting higher stock prices, I’ll be targeting payouts regardless of what happens with the stock.
This is exactly where Jack’s special weekly Tesla play comes in.
He’s traded this setup 85 times so far and won 8 out of 10 trades on average.
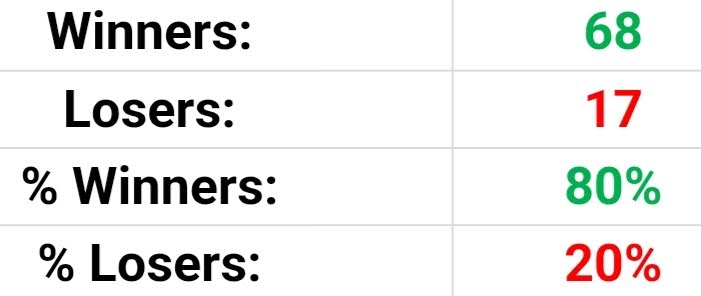
These wins occurred when the stock was either spiking to new highs or slumping across the chart.
And it’s all thanks to a twist in the way he trades the ticker.
I can’t make guarantees when it comes to trading here…
But right now, he’s preparing to go after this week’s payout opportunity.
So if you want a complete breakdown as well as a walkthrough of how to join in…
Here’s Where You’ll Find All The Details
We develop tools and strategies to the best of our ability, but no one can guarantee the future. There is always a risk of loss when trading. Past Performance is not indicative of future results. On the live trades the result is an 80% win rate from 4/05/23 through 12/15/25 and the average return per trade (winners and losers included) is 22.70% per trade in a 6 day average hold time with an average winner of 52.76%.