>>>Join Nate and I weekdays at 10 AM ET for Opening Playbook — we’ll cover the day’s most important, actionable trading opportunities and hot setups, education, strategies and more, CLICK HERE TO JOIN US!<<<
There’s a certain feeling you get when a setup starts clicking into place — not just one indicator flashing green, but multiple layers confirming the same story.
That’s exactly what I’ve seen this week with Amazon (AMZN).
I don’t say this lightly. When I’m calling something a high-conviction trade, it means I’ve checked the weekly chart, the daily chart and the sector backdrop — and they’re all telling me the same thing.
Let me walk you through what I’m seeing.
The Setup That’s Hard to Ignore
Amazon sits in the Consumer Discretionary (XLY) sector, which ranks as the third best sector seasonally right now. Amazon’s positioning in Consumer Discretionary, which is currently the third best performing sector, adds to its appeal. When you’re trading with sector strength at your back, you’re not fighting the current.
But it gets better.
On the weekly chart, momentum is stacking up nicely, and the stock is trading above the previous week’s high — a key metric for signals from my APEX Indicator.
This is the kind of setup I want to see before I get aggressive with sizing. Not a coin flip — a confluence.
Confirmation Across Time Frames
Here’s what I always want to check and what really seals the deal for me on this one.
On the weekly chart, Magic Momentum is green and the Newton Indicator is green. Then I drop down to the daily chart — same picture: green and green. The alignment of momentum indicators across both weekly and daily charts further solidifies the bullish outlook.
When you see that kind of alignment across time frames, you’re not guessing anymore. This is a very high-conviction entry.
I’m not suggesting you blindly follow every signal that pops up. But when the sector is strong, the weekly momentum is building and the daily chart confirms it? That’s when I pay attention.
AMZN is the No. 1 stock I’m watching for APEX signals right now, and if you want to trade it, this is a setup I’d consider placing a trade on right now — whether that’s using a wrap order or whatever strategy fits your plan.
Consider using a wrap order or a strategy that aligns with your trading plan to capitalize on this setup.
Add it to your watchlist. Check the levels. And remember — the best trades aren’t the ones you force. They’re the ones where everything lines up and you just have to show up.
Graham Lindman
Graham Lindman Trading
Follow along and join the conversation for real-time analysis, trade ideas, market insights and more!
- Telegram:https://t.me/+abM5RWRJKrpkNWI5
- YouTube:https://www.youtube.com/@NewMoneyCrew
Important Note: No one from the ProsperityPub team or Graham Lindman Trading will ever contact you directly on Telegram.
*This is for informational and educational purposes only. There is inherent risk in trading, so trade at your own risk.
P.S. Don’t Buy and Hold — Do This
The best way to trade Tesla right now is NOT to buy and hold. Here’s where you’ll find my No. 1 alternative
For one, you can’t be sure what could happen over the next couple of months – especially with the current geopolitical tension affecting EVs, Robotics and AI.
And this is coming from me, who’s bullish on Tesla!
Secondly, you’d have to wait weeks or most likely months to see as much as a double return EVEN if the stock begins to go on a tear.
So instead of buying stock and hoping for a miracle surge, I recommend Jack Carter’s special setup for weekly payout opportunities on Tesla.
He’s been using this setup to target cash on the stock, even during some of the most devastating price drops we’ve seen.
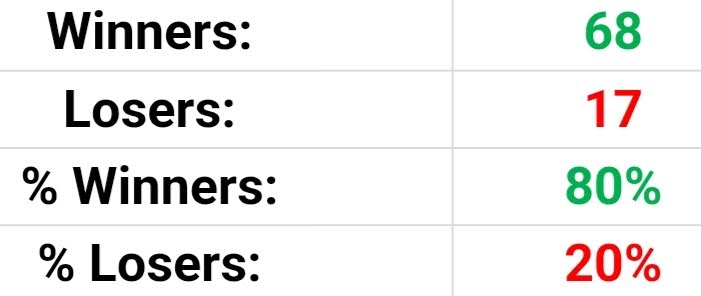
He’s taken 85 trades and so far, he’s won 80% of them.
I can’t make absolute guarantees when it comes to trading of course…
But right now, there’s a brand new opportunity opening up to target cash before the end of the week.
If you’d like to key in while there’s still time…
Head Over Here and Get Started!
We develop tools and strategies to the best of our ability, but no one can guarantee the future. There is always a risk of loss when trading. Past Performance is not indicative of future results. On the live trades the result is an 80% win rate from 4/05/23 through 12/15/25 and the average return per trade (winners and losers included) is 22.70% per trade in a 6 day average hold time with an average winner of 52.76%.