🚨I’ll be live at noon ET 🚨
Roger Scott is out traveling today so I have the honor of hosting his VIP Trade Room — I’m going to teach the opening range breakout strategy and more [tap to join us]!
Look, I know what you’re thinking — the S&P 500 just hit all-time highs, so why would anyone be sitting on cash right now?
Here’s the thing…
I’m not bearish on the market long term. Not even close. But I am being extremely deliberate about when I deploy capital in my trading accounts. If you’ve been following my recent analysis, you know I’ve been pointing to Oct. 20 as my big buy date.
This isn’t based on gut feeling or market sentiment. It’s based on multiple converging data points that I’ve been tracking closely — and they’re all telling the same story.
Let me walk you through why I’m staying patient…
The Seasonal Pattern That Keeps Repeating
When I dig into the seasonal data, the pattern is remarkably consistent. Over the last 30 years, the S&P has typically peaked around July 15-20 and bottomed in mid-October. That’s not just one or two years — that’s three decades of data.
The Nasdaq follows a similar pattern, peaking in mid-July and bottoming in mid-October before a strong end to the year. The semiconductor index — including high-flying names like Micron (MU), AMD (AMD) and SanDisk (SNDK) — also tends to peak in mid-July and bottom near the end of October.
Even with technology holding the No. 2 spot in sector rankings, its one-month change was negative. That matters because it shows that leadership alone doesn’t eliminate near-term volatility.
This is why I sold by July 20 in my trading accounts. My long-term investment accounts? I haven’t touched those. But for active trading capital, I wanted to be positioned in cash through this historically choppy period.
My plan is clear: Deploy capital on Aug. 15 and Sept. 15, then put the remaining dry powder to work on Oct. 20. That’s when I expect the highest-conviction entry point.
The 1998 Parallel That’s Almost Uncanny
Now here’s where it gets really interesting… and a little eerie.
When I overlay the current Nasdaq pattern with what happened in 1998, the similarities are striking — and the comparison lines up with the broader seasonal data as well. Back then, the market peaked in July, declined and bounced in August near the upper boundary of its downtrend channel.
Then it took another leg lower before bottoming in October. The timing is almost uncannily close to the pattern I’m watching now.
I’m not saying history repeats perfectly — it doesn’t follow an exact script. But when historical patterns align with seasonal tendencies and current technical signals, they provide a decision-making framework that goes far beyond guesswork.
Even with the S&P at all-time highs, the Nasdaq remains in a downtrend channel and is trading near its 50-day moving average. That tells me we’re not out of the woods yet.
This isn’t about being bearish. It’s about being patient and waiting for the setup that offers the best risk-reward ratio. I’d rather hold cash and wait for a high-conviction entry than chase moves without seasonal tailwinds.
While others debate every tick in the indexes, I’m sticking to the plan. Sometimes the best trade is the one you don’t make — until the timing is right.
Graham Lindman
Graham Lindman Trading
Follow along and join the conversation for real-time analysis, trade ideas, market insights and more!
- Telegram:https://t.me/+abM5RWRJKrpkNWI5
- YouTube:https://www.youtube.com/@NewMoneyCrew
Important Note: No one from the ProsperityPub team or Graham Lindman Trading will ever contact you directly on Telegram.
*This is for informational and educational purposes only. There is inherent risk in trading, so trade at your own risk.
P.S. I Want to Help Cut Your Trading Down to 1 Hour a Day
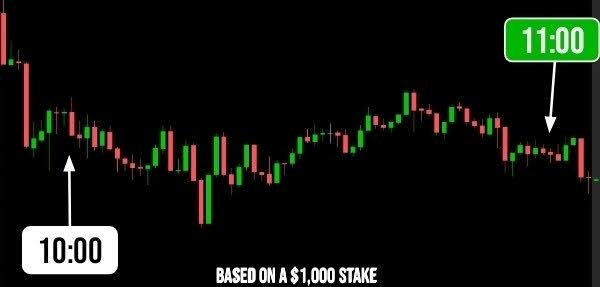
My powerful setup targets a brief 60-minute window that gives regular folks a shot at 50%+ returns…