🚨 I’ll be live at 10 a.m. ET with Nate Tucci🚨
We’ll talk about allocation and position sizing, a tool you can use that doesn’t cost a thing and more [tap to join us for Opening Playbook]!
Sometimes the charts tell you everything you need to know, and right now they’re practically screaming at us. I’ve been digging deep into seasonal patterns for Republican midterm election years and what I found has me genuinely excited about the weeks ahead.
The data goes all the way back to 1945 so we’re not talking about some fluke pattern based on a handful of data points. When I look at the Republican midterm pattern, it shows something fascinating: choppy, slightly downward price action that’s not at all-time highs — just ugly trading through February.
And right at the end of February, markets typically take a turn. They break higher from there. From the bottom to the top, we’re looking at about a 4% move.
Historically speaking, this has been one of the most reliable inflection points in these specific midterm years, and what stands out is how closely the current market is following that same script.
We’ve seen months of frustrating, range-bound trading that’s left many people scratching their heads. But understanding this seasonal context changes everything.
The Late February Inflection Point
What happens next in the pattern is where things get interesting. At the end of February, the markets tend to rotate higher after that grinding, indecisive stretch.
We’re talking about a meaningful, historically consistent rally that extends into spring.
Energy (XLE), Materials (XLB) and Industrials (XLI) are generally at the top of the list when this seasonal pattern kicks in. Right now, we are seeing this behavior play out again to a T, like it so often does. These sectors benefit the most from improving market sentiment, early-cycle strength and capital rotation that typically follows the February bottom in these years.
My prediction is we’re gonna see the same kind of market action as last week — more consolidation before the next leg. That aligns perfectly with what the historical pattern suggests, which is why this period of chop should not be viewed as weakness but as preparation.
Positioning for the Spring Rally
The timing here is crucial. While I expected more consolidation this week, I believe toward the end of this or early next week we may see that turn for the better. The choppy action we’ve been experiencing is not a warning sign of impending doom…
It’s what has been the normal setup phase that historically precedes spring strength in Republican midterm years. And you better believe Donald Trump wants this market higher heading into the election.
For traders, this means the current environment represents a positioning phase before what could be a historically favorable spring period. The key is recognizing that we’re likely at the tail end of this consolidation, with the seasonal pattern suggesting a meaningful turn higher is approaching.
Graham Lindman
Graham Lindman Trading
Follow along and join the conversation for real-time analysis, trade ideas, market insights and more!
- Telegram:https://t.me/+abM5RWRJKrpkNWI5
- YouTube:https://www.youtube.com/@NewMoneyCrew
Important Note: No one from the ProsperityPub team or Graham Lindman Trading will ever contact you directly on Telegram.
*This is for informational and educational purposes only. There is inherent risk in trading, so trade at your own risk.
P.S. You Want More Than Just the Lotto Board on Saturday?
A while back, I ran a poll in my Telegram channel about the Lotto Board…
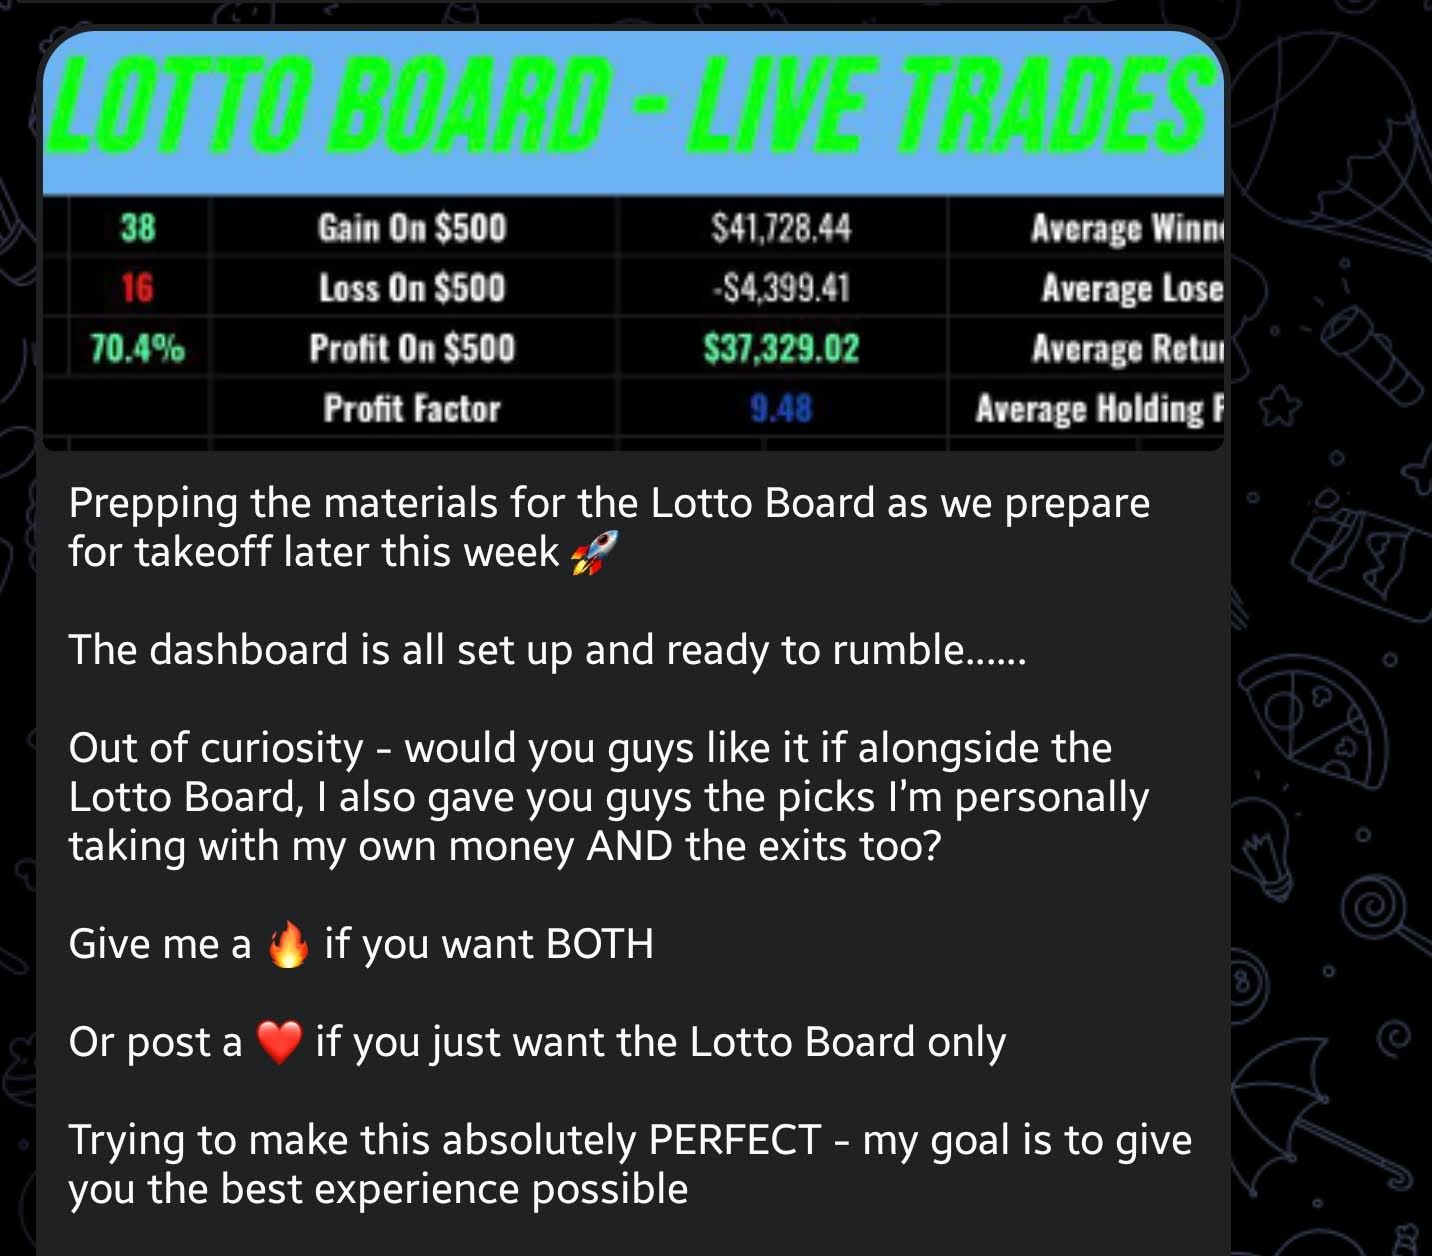
The response was clear: You want more than just access.
Which tells me when I open the doors at 11 a.m. ET on Saturday, you’ll have your hands quite full.
I’ll share the full details very soon, but for now, make sure you don’t miss the Lotto Board Red Carpet Event this Saturday.
Here’s what’s on the agenda.
I’ll give you a complete inside look at how the Lotto Board isolates 2x, 3x and even 4x or more opportunities on a daily basis.
You’ll see the intentional mispricing that creates those setups in the first place… the actual math behind why these opportunities show up…
And then I’ll show you where to get full access to the Lotto Board.
I can’t make absolute trading guarantees…
But at the end of the Red Carpet Event…
You’ll have the opportunity to start using the Board for your own trades as early as next Monday.
All you have to do is register to save your seat…
We develop tools and strategies to the best of our ability but no one can guarantee the future. There is always a risk of loss when trading. Past Performance is not indicative of future results. Between 1/8/26 through 2/17/26 the “Lotto Board” trades taken with real money by Graham Lindman have produced a 79.5% win rate, with an average return of 170% and an average winner of 230% over a 9 day hold time on average – and a 19.93 Profit Factor