🚨 I’ll be live at with Alex at 2:30 p.m. ET🚨
Markets are tanking today, but Alex and I are looking directly at order flows to hunt for weekend swing trades. Plus, with SpaceX coming next week, join the room to see exactly what positions are being put on to prepare [tap to join us for Profit Panel]
When I was coming up in this business, I learned the hard way.
I wasn’t handed a bunch of charts with moving averages and indicators. I was taught to read price — just price — and see exactly where the money was flowing without needing any pictures to tell me.
That was the school I came from. I was taught the hard way to read a market as opposed to an easier way. Literally.
Let me explain it this way.
Remember those kids’ books, “Cat in the Hat,” and “Frog and Toad”? They had pictures on every page that described the story.
You could look at the pictures and understand what was happening, right?
Now grab a Stephen King novel and count how many pictures are in it. Hardly any — just a sparse few to prime your imagination.
Why? Because King gives you every description you need and your mind creates the picture.
You might put bushes on one side of the house, I might stick a big tree in the front yard because I like shade. Our mental images might be a little different, but we’re both seeing the same setting.
That’s how I learned to read the market — not by looking at pictures, but by seeing the flow in the prices themselves.
Learning Charts Backward
For most traders, charts come first. For me, they came much later.
At some point I had to stop and ask myself, what’s all this chart stuff people are talking about?
So I went back and started digging into moving averages, indicators and all the overlays everyone swears by — the whole sha’bam. I had to learn it backward after already knowing how to read the market without it.
And here’s the thing. When I check something like the S&P 500 (SPY) page on Barchart.com’s Trader’s Cheat Sheet, the levels it spits out match the same levels I can see just by watching price trade every day.
The information is identical. The difference is whether you’re relying on pictures or you’re reading the story directly from the numbers.
These days, if I’m looking at a stock, I’ll chunk it up quickly and focus on the key pieces: the month open, the week open, the current highs and lows, and the current average range.
If I can nail those down, I know on average how much a stock is going to move when it opens. Then the only question I need to answer is: up or down today?
If the move stays inside the average range, I’m targeting 30% to 40%. If it exceeds that range, I can push for 80% to 90%.
Why This Matters to You
Most traders get buried in technical indicators and overlay after overlay thinking more information equals better trades. It doesn’t.
What matters is learning to see the market — understanding what price is telling you about where money is actually moving.
Charts can help, sure. But they’re just another way of showing you what’s already there in the price action.
Once you learn to read prices the way I do, you realize the market isn’t that complicated.
It’s just describing itself to you — no pictures required.
You just have to know how to listen.
Geof Smith
Geof Smith Trading
Follow along and join the conversation for real-time analysis, trade ideas, market insights and more!
- Telegram: https://t.me/+lm8_Nq3Su104NmFh
- YouTube: https://www.youtube.com/@FinancialWars
Important Note: No one from the ProsperityPub team or Geof Smith Trading will ever contact you directly on Telegram.
*This is for informational and educational purposes only. There is inherent risk in trading, so trade at your own risk.
P.S. What the Media Outlets Are Completely Ignoring Right Now
By now, you might be aware that the Senate recently confirmed the new Fed Chair.
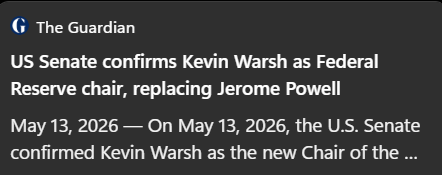
And based on my research… Warsh might set in a huge shift that I’m not seeing the media outlets talk about enough.
A shift that could prove rewarding for traders in the know.
I’ve spent three decades trading the markets…
And over the years, the Fed has singlehandedly triggered this shift, and it’s been rewarding for folks in the know.
I recently went on camera to spill the beans about this massive shift that Warsh could bring as Fed Chair.
And I also reveal the no.1 play every trader needs to know to take advantage of.
I won’t make reckless guarantees…
But if you want the details on this approach…
Tap Here to Get the Entire Breakdown
Disclaimer: We develop tools and strategies to the best of our ability, but we can’t guarantee the future. There is always a risk of loss when trading. Past performance is not indicative of future results. Since LIVE trading began on 9/18/25, there have been 24 trades, with 20 winners and 4 still open, continuing the undefeated streak. In LIVE trading, the average return has been 32.03%, and the average hold time has been 17 days.