🚨 I’ll be live with Alex Reid at 2:30 p.m. ET🚨
Is it finally time to buy oil stocks again? Beverage names are starting to push higher and honestly, I might need a drink, while defense stocks are back on the move as money rotates. We’ll break down what’s real, what’s noise, and where the opportunities may be, click HERE to join LIVE!
I want to share something most traders today don’t know — and it explains why so many struggle with tools that used to work like magic.
I’m 60 years old. I’ve been doing this since the late 1980s. And let me tell you, the way we trade now compared with how we traded back then is a completely different world.
When Charts Required Actual Work
Back in the 1970s and ’80s, we didn’t have computers. If you wanted to analyze a stock, you either subscribed to a Morningstar chart book or pulled out graph paper and drew it by hand.
I started in the late 1980s when IBM XTs were just coming out. Lotus had a program called Lotus 1-2-3 that ran on a 5.25-inch floppy drive. You could plot points and build your own charts — but it took real effort.
That manual process is exactly why moving averages and other indicators were created. Traders needed a way to decipher trend strength without doing calculus on every bar.
Back then, one name dominated the conversation: John Bollinger.
He was on financial television regularly, breaking down market action using the volatility envelopes he designed — Bollinger Bands.
They were a revelation for traders who needed a simple way to visualize expansion and contraction on daily and weekly charts, which were the primary time frames people worked with at the time.
Those bands were built for a world where price data arrived slowly and charting was methodical by necessity.
Why Modern Traders Break What Used to Work
When charting software exploded and intraday time frames became accessible, traders started slapping Bollinger Bands on 3- and 5-minute charts — then complained they didn’t work.
Of course they didn’t.
The tool was never designed for hyper-short time frames or the noise that comes with them.
Traders took something built for structured, deliberate analysis and tried to force it onto charts that move like hummingbirds on caffeine.
That’s the real lesson.
Indicators weren’t created in a vacuum. They were solutions to real problems traders faced in an era of manual charting.
When you understand the original purpose of a tool, you know how to use it correctly. When you don’t, you end up forcing it into situations it was never meant for — and wondering why your edge disappeared.
Before you load up another oscillator or moving average, ask yourself one question:
Do I know what problem this was designed to solve?
That question alone will save you more headaches than any strategy tweak ever could.
👉 Click here to join Profit Panel at 2:30 p.m. ET on weekdays!
Geof Smith
Geof Smith Trading
Follow along and join the conversation for real-time analysis, trade ideas, market insights and more!
- Telegram: https://t.me/+lm8_Nq3Su104NmFh
- YouTube:https://www.youtube.com/@FinancialWars
Important Note: No one from the ProsperityPub team or Geof Smith Trading will ever contact you directly on Telegram.
*This is for informational and educational purposes only. There is inherent risk in trading, so trade at your own risk.
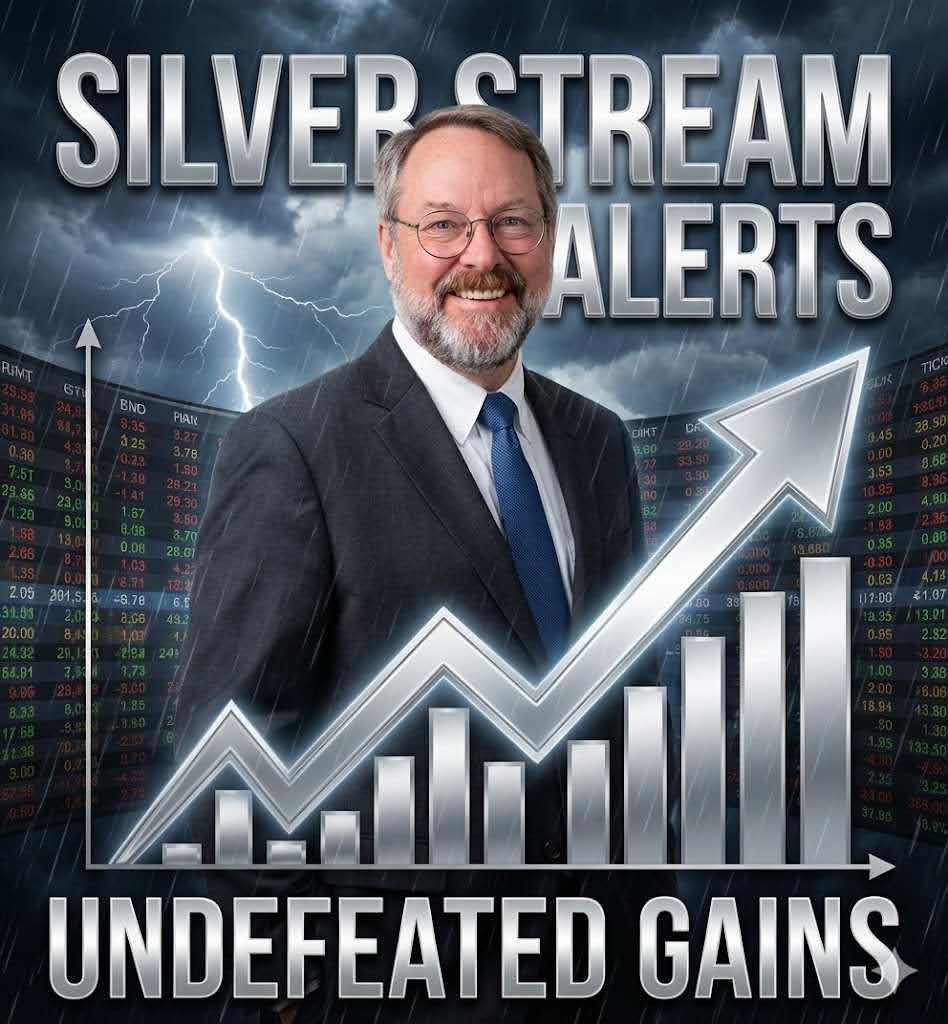
PS. Did You Miss the Hottest Silver Play This Year?
I just wrapped a killer session after grinding through charts and backtests to drop my unbeatable Silver Stream strategy — targeting about 30% gains on SLV, with zero losses in five years — at the Fed Day Roundtable.
The big shock — aside from Friday’s massive sell-off?
Folks saw firsthand how this weekly spread setup stacks winners fast — averaging $504 per $2,000 invested — without the guesswork.
Long-term holds, auto-profits and alerts straight to you.