🚨 I’ll be live at 2:30 p.m. ET with Alex Reid🚨
We’ll cover the impact of the U.S.-brokered peace plan on crude oil, Nvidia’s massive $1 trillion AI demand forecast, the sudden shift in Fed rate cut expectations and more [tap to join us for Profit Panel]
You’ve probably noticed crude oil’s wild run from $65 to $100. Most traders are trying to read war headlines and OPEC statements to figure out where it goes next.
But here’s what almost nobody realizes: There are actually two separate crude oil markets operating right now — the physical oil market and the financial oil market — and they’re completely decoupled. When you step into the real world and look for actual barrels, you quickly discover there’s very little physical oil available.
That imbalance is the real story behind crude’s behavior.
The Physical Market Nobody Can See
On the financial side, crude oil contracts are trading all over the place — it’s largely paper flow driven by headlines and technical levels.
But when you look for physical supply, it’s a completely different picture. Oil has been constrained, sanctioned, and blocked by so many forces that the flow itself has broken down. Insurance costs have become so prohibitive they’ve effectively shut down about 20% of global oil movement, leaving shipments stalled rather than delivered.
There are ghost ships operating under different flags just trying to move cargo, and even the International Energy Agency doesn’t fully know how much oil is out there because it isn’t moving.
Whether this turns into a long or short conflict only adds another layer of uncertainty, especially with real damage already done to infrastructure that was fragile to begin with.
What Happens When Reality Sets In
Right now, crude is hovering around $90, and while the financial market reacts to headlines in the short term, the underlying issue runs deeper. Eventually, traders will have to confront the same question the physical market already is — war or no war, where’s the oil?
When that realization hits, prices don’t just drift higher — they reset. Crude likely isn’t done moving higher and could reach $125 to $140, because these supply constraints are structural, not emotional.
This isn’t a short-term geopolitical trade. Until physical flow starts moving again, there’s no clear path back to $65. Financial contracts can fluctuate, but when supply is this tight and difficult to transport, the floor rises and holds.
That’s the piece most traders are missing — and it’s the one that matters most.
👉 Click here to join Profit Panel at 2:30 p.m. ET on weekdays!
Geof Smith
Geof Smith Trading
Follow along and join the conversation for real-time analysis, trade ideas, market insights and more!
- Telegram: https://t.me/+lm8_Nq3Su104NmFh
- YouTube: https://www.youtube.com/@FinancialWars
Important Note: No one from the ProsperityPub team or Geof Smith Trading will ever contact you directly on Telegram.
*This is for informational and educational purposes only. There is inherent risk in trading, so trade at your own risk.
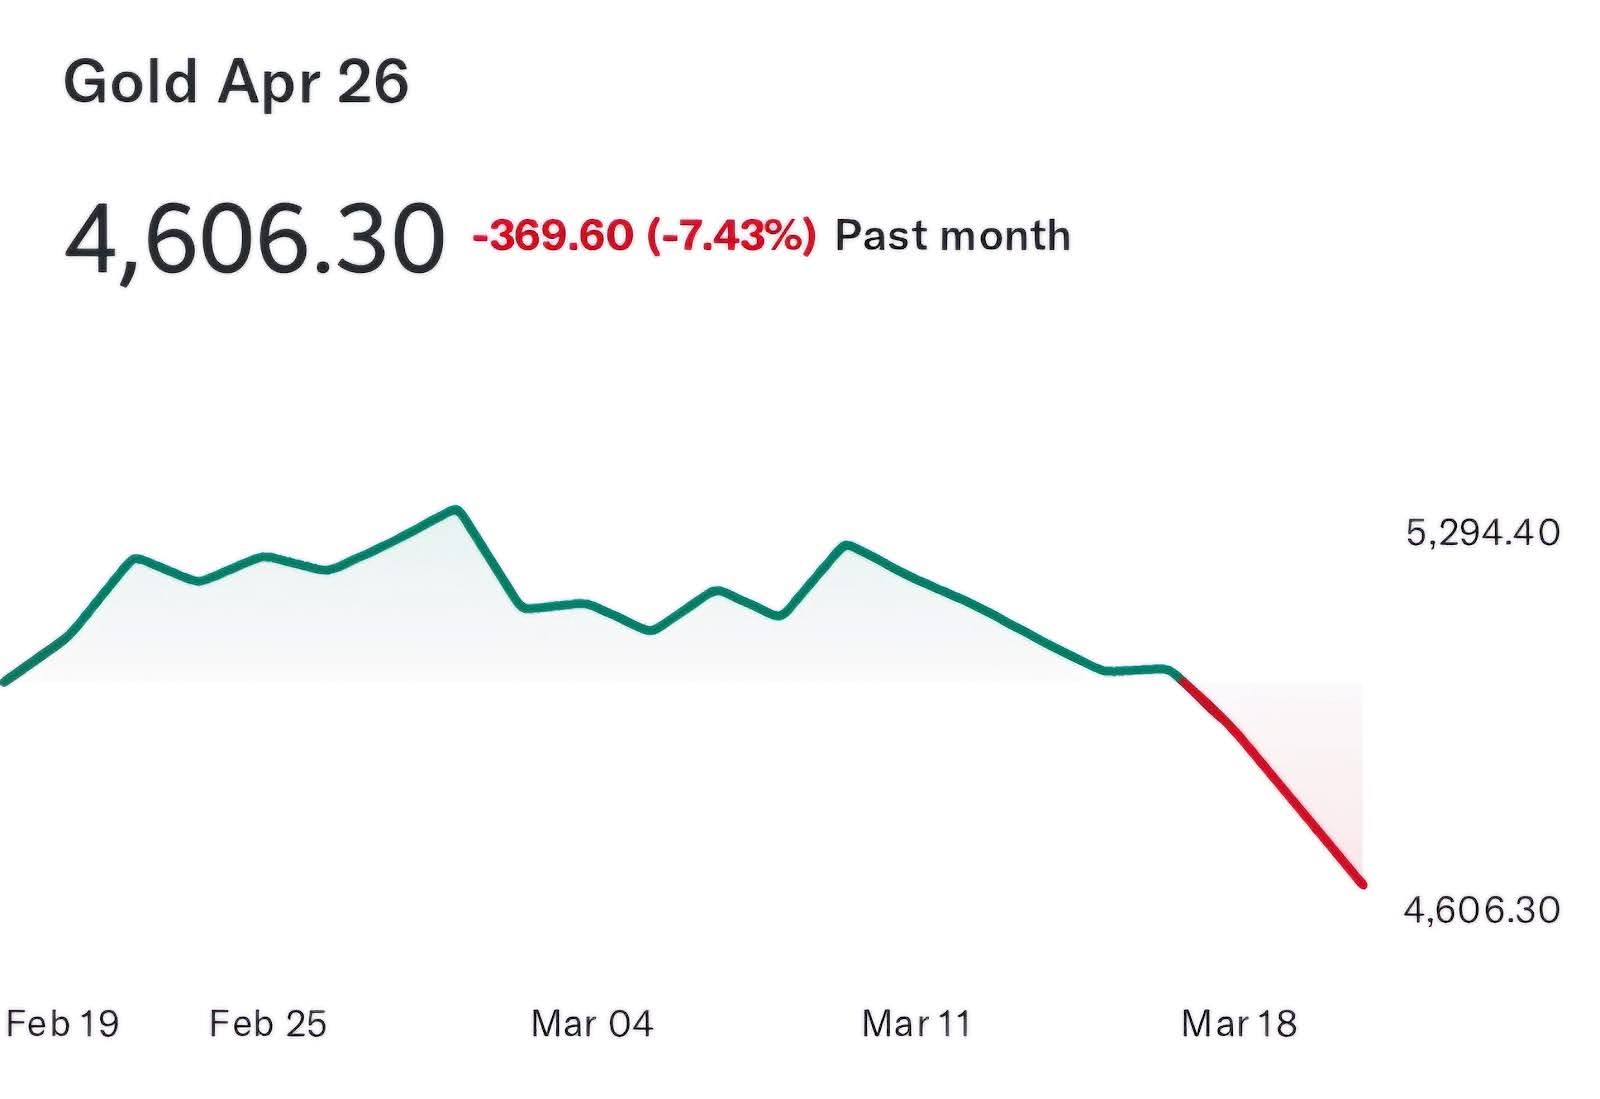
P.S. GOLD: My Methodical Approach Just Hit Its 60th Winner
Gold is at a turning point.
With tensions around Iran still in focus, many expected it to push toward new highs by now.
Instead, price action has been choppy… and that leaves traders with a key question:
Is gold gearing up for another run… or starting to lose momentum?
What happens next likely comes down to how this situation unfolds.
If tensions rise, gold could move quickly.
If things cool off, the reaction could catch a lot of traders off guard.
That’s why I put together a focused Gold broadcast.
Inside, I explained:
- Where gold stands right now
- How it typically reacts during geopolitical events
- And whether this sets up a move toward new highs or something else
No guarantees, of course.
But if you want a clearer view of what could come next, you’ll want to take a look.
Disclaimer: We develop strategies to the best of our ability, but we cannot guarantee a future return. There is always a risk of loss when trading. Past performance is not indicative of future results. Since 12/05/2024, the trading approach discussed today has published 60 trade alerts. All 60 have returned as winning trades, for a 100% win rate. The average return per trade, winners and losers combined, has been 16.88% on an average holding period of 9 days.