The market shot up at the open Wednesday morning, and if you missed why, here’s the rundown.
We got the Producer Price Index report, and it came in softer than just about anyone expected.
That gave traders the green light to bid things up right out of the gate. That initial surge is something we often see around major economic releases. Markets react fast, pricing in the surprise within minutes, but what happens after the opening move is usually far more telling.
In this case, the market did exactly what it tends to do on strong data shocks: It made a big move early, then churned sideways for the rest of the day.
When a release hits well outside expectations, algorithms and short-term traders strike first. But if there is no conviction afterward, the session settles into a tight range. Understanding that dynamic can save traders from chasing the open only to get stuck in intraday chop.
Let me walk you through what the PPI actually showed, because the details matter.
Breaking Down the PPI Numbers
On the month-over-month side, PPI came in at negative 0.3%. For context, CPI the day before was negative 0.4%, so we’re seeing consistent deflationary pressure in the most recent data.
Core PPI registered at 0.2%, which was below expectations. That matters because core strips out the volatile food and energy components, giving a cleaner read on underlying inflation trends.
Year over year, PPI was expected to come in at 6.2%, but the actual number was 5.5%. Core PPI was expected to come in at 5.2%, but the actual reading was 4.7%.
Every metric came in softer than expected. The data confirms what many have been watching: Inflation pressures are cooling faster than the Street anticipated.
That raises the odds the Federal Reserve will have more flexibility heading into future policy meetings. A sustained slowdown in producer costs supports the case for a gentler stance — or at least reduces the pressure for additional tightening.
What It Means for the Market
Strong economic data isn’t the only thing shaping sentiment right now. Strong earnings from the Financial Select Sector SPDR Fund (XLF), especially from JPMorgan Chase (JPM), are adding fuel.
JPM blew expectations out of the water, and that kind of leadership from the banks tends to bolster confidence across the broader market. When financials come in strong at the same time inflation data softens, it creates a supportive backdrop for equities.
Still, it’s important to keep the intraday structure in perspective. The market shot up off the PPI report, then spent the rest of the session trading inside that opening 30-minute range — just like it did the day before.
A strong open doesn’t automatically turn into a strong trend day. That’s where trader psychology comes into play. The initial reaction is often driven by headlines and speed, but sustained moves require participation, volume and follow-through. Without those, the early pop becomes noise rather than signal.
If you’re planning trades around data releases, understanding that distinction is essential. The first move can be powerful, but it isn’t always the real direction.
Risk management and strategic planning matter more on days when the market explodes at the open but refuses to expand beyond that range.
I’m watching to see whether the market can build on this combination of cooling inflation and strong corporate results — or if we’ll continue grinding sideways until the next major catalyst shows up.
Geof Smith
Geof Smith Trading
Follow along and join the conversation for real-time analysis, trade ideas, market insights and more!
- Telegram: https://t.me/+lm8_Nq3Su104NmFh
- YouTube: https://www.youtube.com/@FinancialWars
Important Note: No one from the ProsperityPub team or Geof Smith Trading will ever contact you directly on Telegram.
*This is for informational and educational purposes only. There is inherent risk in trading, so trade at your own risk.
P.S. Trump’s Fed Choice Just Lit the Fuse
Two years ago, I made a public prediction that ruffled a lot of feathers.
I stated that three giant “mega-catalysts” were about to trigger a historic, multi-year run in one specific asset.
Almost immediately, the first two triggers went off.
And the results were absolutely wild.
I’m talking about a perfect 52-for-52 trading record last year.
52 weeks… 52 trades… 52 wins.
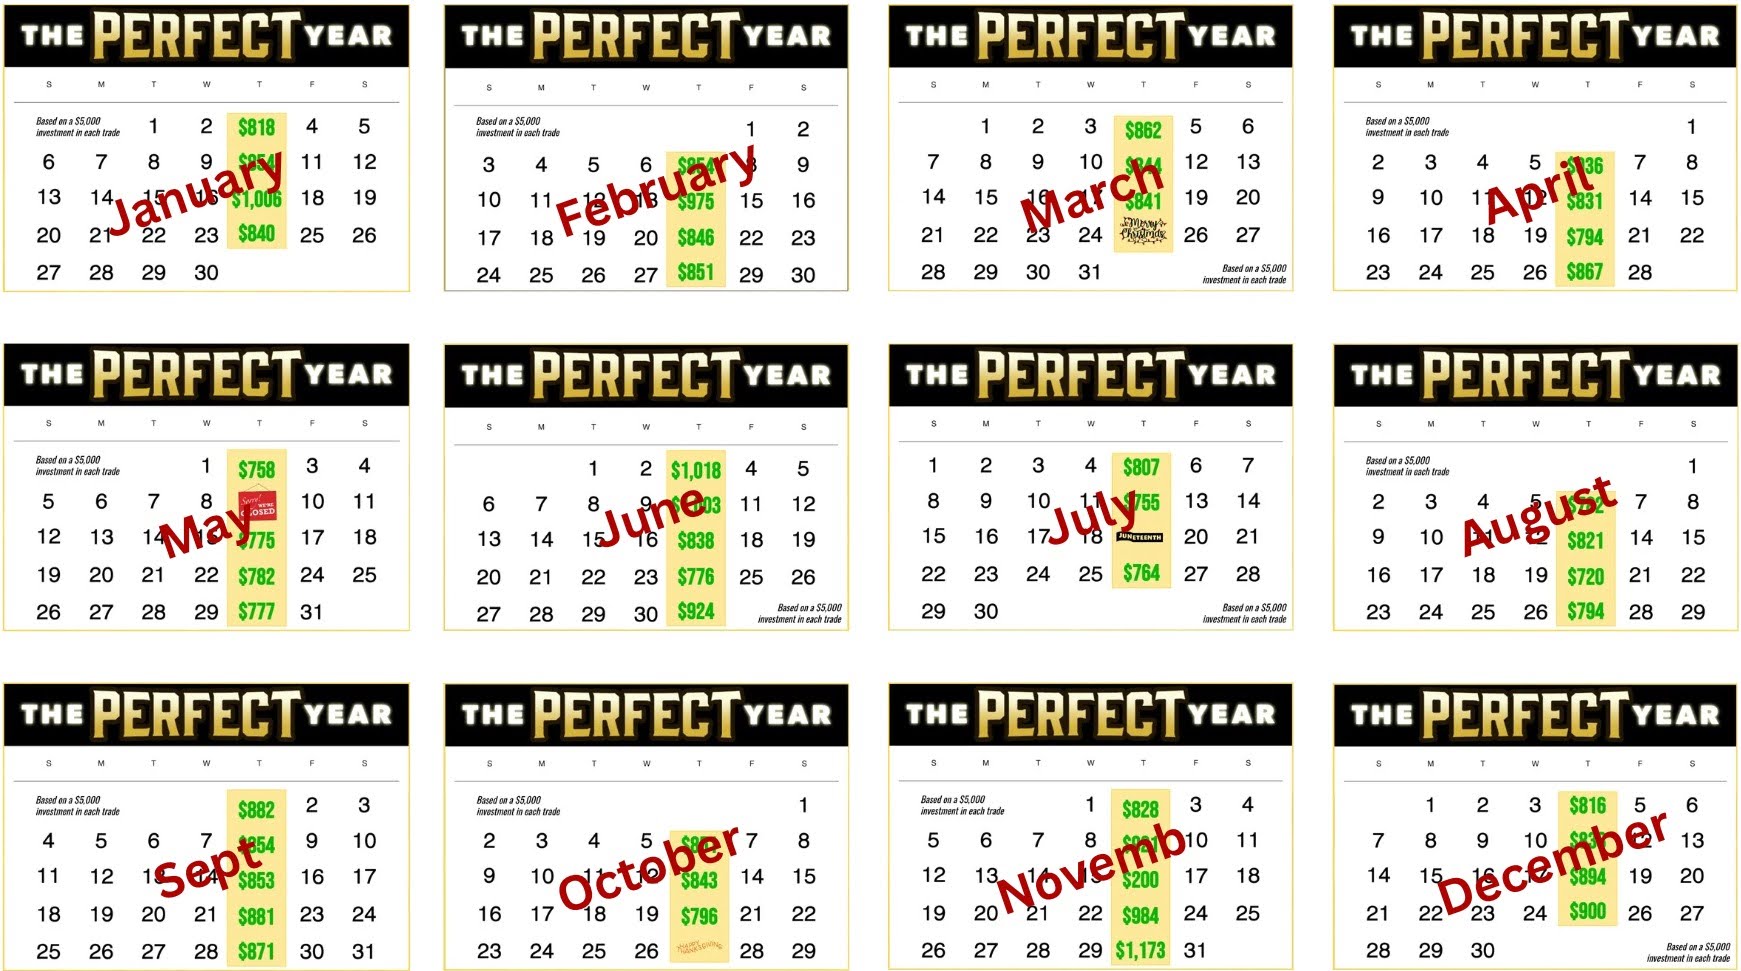
Regular folks had the chance to pocket an extra $43,717 in a single year… without ever reinvesting or compounding.
Just tapping into a simple weekly setup to target $841 payouts like clockwork.
But here is the crazy part…
We did all of that… while catalyst number three was still lying dormant.
It never triggered.
Until right now.
You see, a new hand-picked choice has officially taken over the Fed.
And he is under immense pressure to start aggressively slashing interest rates.
I’ve spent 25 years trading these markets, and history is very clear on what happens next.
Every single time this specific rate-cut cycle happens, this exact $4,000 asset doesn’t just rise… it historically explodes.
In the 70s, it skyrocketed 369%… then another 521%.
In the early 2000s, it surged 536%.
And now, the fuse on catalyst number three is officially lit.
In fact, as soon as the calendar turned to July, this asset started heating up again… signaling that the next major run-up is starting right now.
If you think the run we had last year was impressive… you haven’t seen anything yet.
This rate-cut cycle is going to pour absolute gasoline on our weekly payouts.
And we are setting up our very next trade this week.
This Saturday, July 18th at exactly 1 p.m. ET, I am hosting an urgent, live briefing.
While I cannot make any guarantees in the market…
I’ll show you the exact sequence of events about to unfold…
And how you can copy my exact weekly setup over my shoulder to target these $841 payouts as this historic cycle takes off.
I’m not charging a dime for this briefing, but the virtual room will fill up fast.
If you’d like to join me…
Disclaimer: Since 12/05/2024, the trading approach discussed today has published 66 trade alerts. 65 of 68 have returned as winning trades, for a 95.6% win rate. The average return per trade, winners and losers combined, has been 12.84% on an average holding period of 10 days. With a $5,000 starting stake, every trade targets about $841 in returns, and every trade you see today will be based on that $5,000 starting stake unless otherwise stated.