The winds have shifted on U.S. stock markets.
The tailwinds that took the S&P 500 to its second highest price-to-earnings multiple in 150 years have turned into headwinds.
Tighter money means less consumption and negative earnings growth. Higher interest rates mean every dollar of future earnings is worth less today. And less price stability resulting from high inflation makes the real value of those earnings less certain.
Now, these tailwinds alone would be enough to put equities in a deep bear market. Add in unprecedented geopolitical turmoil and that same bear market easily pencils out into full blown collapse.
But you don’t have to panic.
By at least acknowledging the potential of this scenario, you’ve taken the first step towards turning today’s bear market into your advantage.
Because then, rather than trying to call the bottom, buying dips, or obsessing over a 100-point rally in the S&P, you can focus on positioning your portfolio to profit from the next 1,000 points down…or more.
And, as I’m about to show you, I didn’t just pull those numbers out of thin air.
Past is Prologue
Exactly what level to which the S&P 500 falls isn’t the most important consideration. But it’s helpful to know what’s possible before you get there.
To help with that, I’m going to show you ways to model how we can arrive at two different price levels — 2018 and 2015 highs.
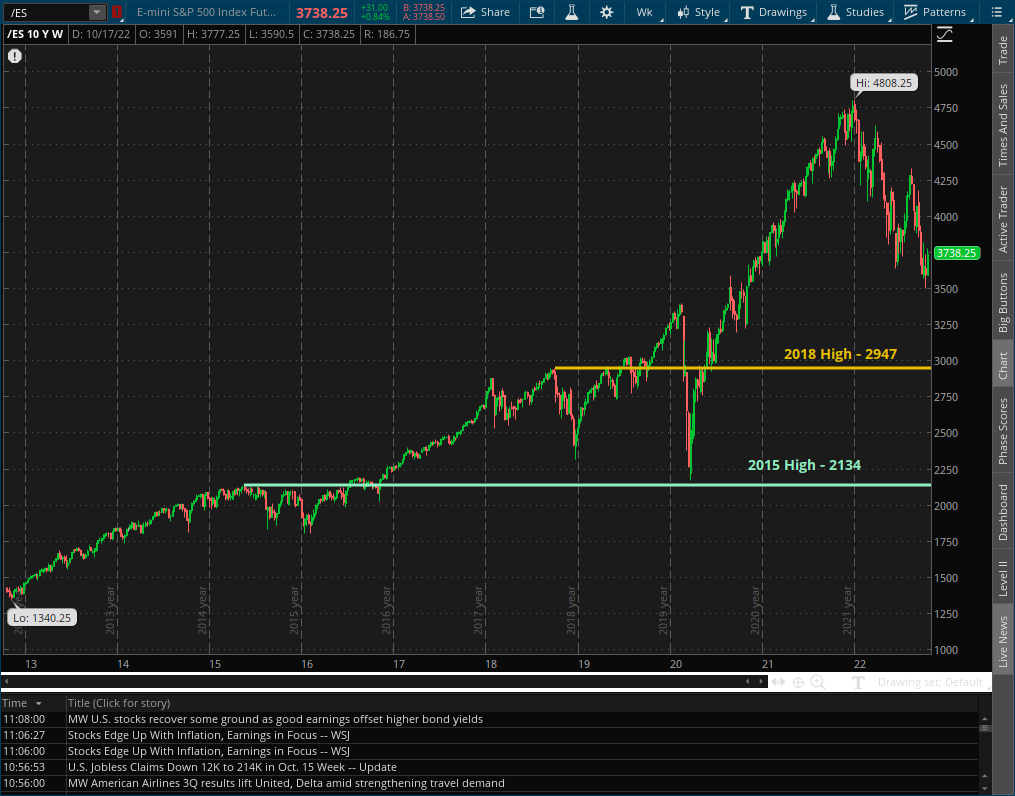
These two levels, 2,947 and 2,134, represent declines of 39% and 55% from last December’s peak of 4,808 on the S&P 500 (this is the futures contract, so the numbers might be slightly different than published index levels). This would wipe out 5 years and 7 years of price appreciation, respectively. And before you say, “no way,” you may want to look at history.
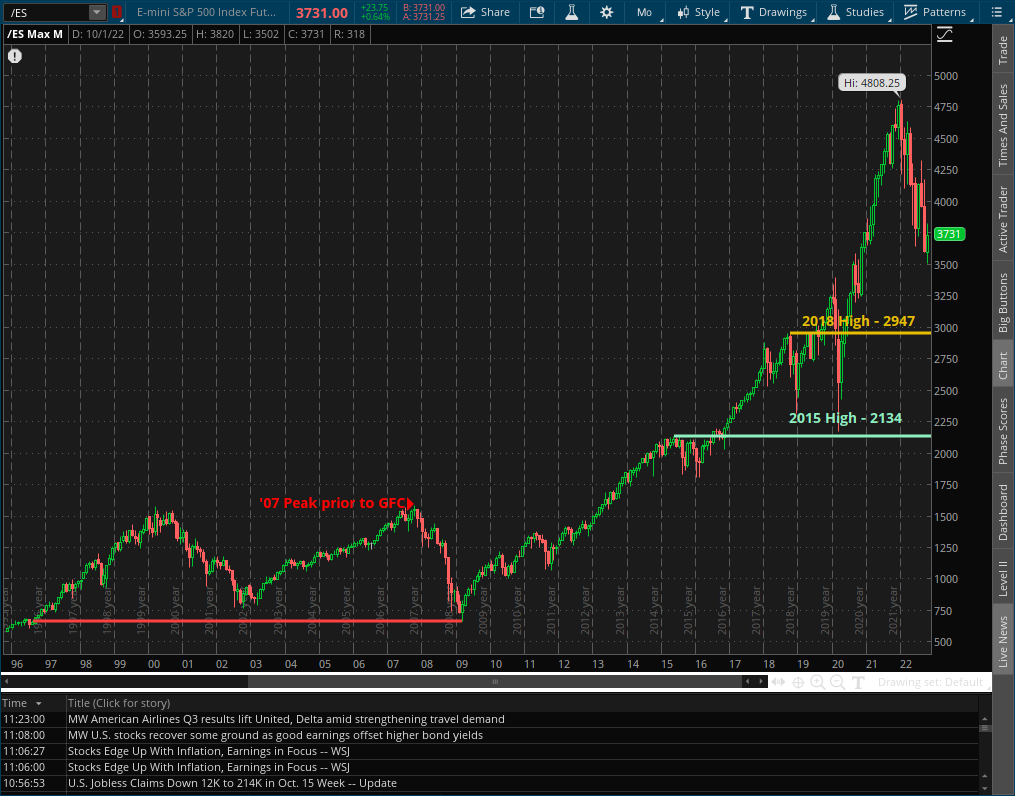
Pushing the chart back further, you can see that the Great Financial Crisis (GFC) wiped out 11 years of gains (2007 to 1996) by dropping 58% from its peak. So, you can’t deny the possibility of a 39% or 55% drop based on history.
But you don’t have to point blindly to history and assume it will repeat. There’s method to the madness. So let’s take a look at what becomes possible once you factor in the headwind of negative earnings growth.
Economic Profits
Before we start, I realize there’s no better way to get you to stop reading than by working through interminable finance math. To keep you with me (because this is important) I’ll just step lightly through my reasoning to the conclusion trusting that you trust me to get the theory and math right.
And we’ll start with the most extreme case based on economic profits.
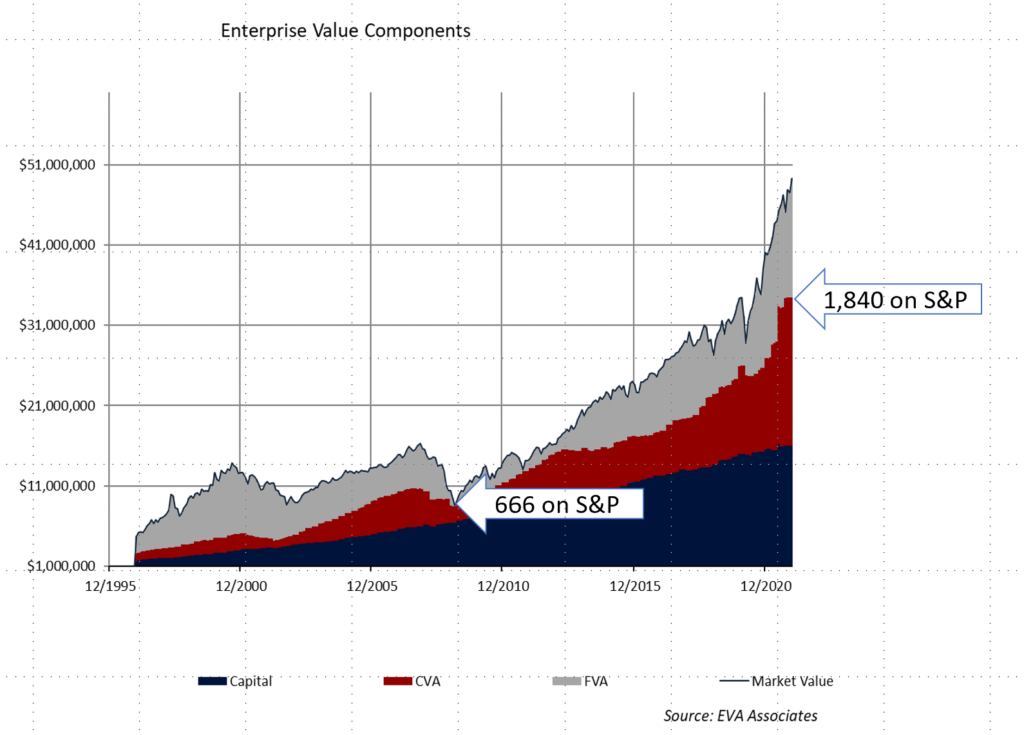
The chart above breaks the value of all companies in the S&P 500 into three components all the way back to 1996.
The blue area is the capital base (Capital).
This is the amount that companies invest in their business. It’s what book value of assets is to traditional financial statements – if that helps. The red area represents the value of future earnings today assuming no earnings growth (Current Value Add or CVA). And the grey area represents the degree of earnings growth currently priced into stocks (Future Value Add or FVA).
Add them all together and you account for the market value of all companies in the S&P 500.
In 2009, when the S&P bottomed out at 666, it wiped out all of the grey area, giving no value to earnings growth. What remained only gave stocks the benefit of current earnings. And those earnings were down considerably from their peak.
That, by the way, was when I finally decided to go long stocks back in the day.
Last December, the value of current earnings equated to 1,840 on the S&P — a 62% drop from December’s highs. So, a return that that level would take us well below 2015 levels. And that assumes corporate earnings stay the same.
Indeed, earnings are no longer growing. This chart from macrotrends.net shows S&P earnings plateaued a year ago (the orange line with earnings at 198.32 as of May).
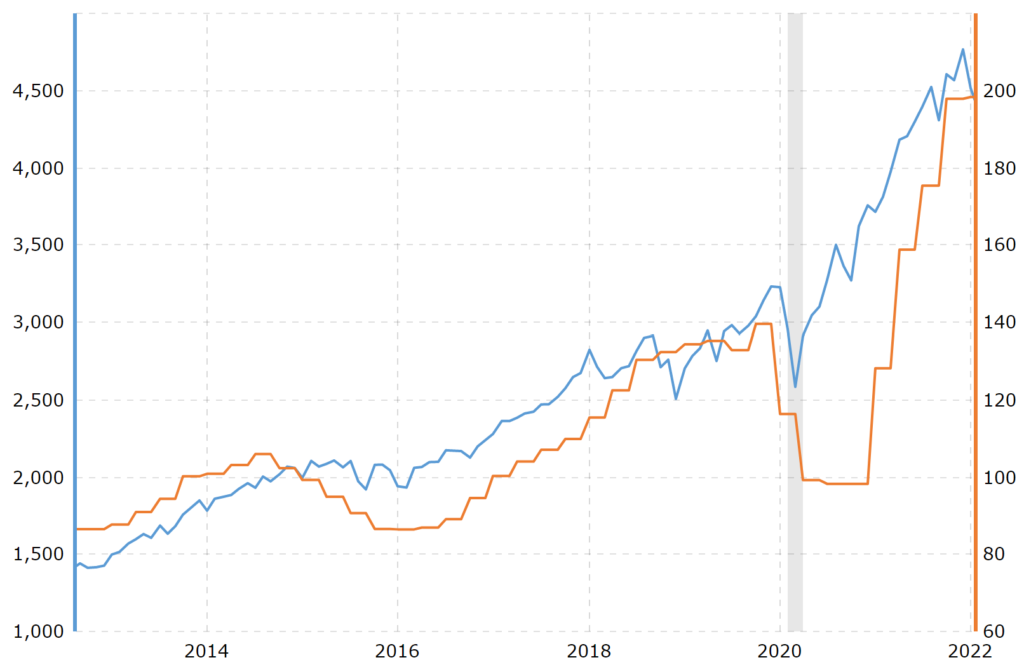
And given that we’re in a recession (yes, that’s my call) we’ll soon see them fall.
Now, there’s no need to bend over backwards guessing just how far they could fall only to project even lower levels for the S&P 500. There are a lot of moving parts and I’m not fool enough to waste time with all the iterations. The point is that should markets no longer give future earnings the benefit of the doubt — which, as I’ve shown, is not unprecedented — the drop can unwind many years of progress.
And charting out possibilities based on economic profits isn’t the only way to gauge how steeply investors can discount future earnings.
Real Price-to-Earnings Multiples
Another approach is the familiar price-to-earnings (PE) multiples. It measures how large of a premium investors are willing to pay for future earnings. The higher the multiple, the higher the premium. And you can say that when that multiple is high, investors expect a lot of earnings growth in the future.
But the traditional metric got an upgrade a little more than two decades ago when Robert Shiller published his book “Irrational Exuberance.” It came out at the very peak of the internet bubble, to the month, and provided a new, more meaningful way to calculate price-to-earnings (PE) multiples.
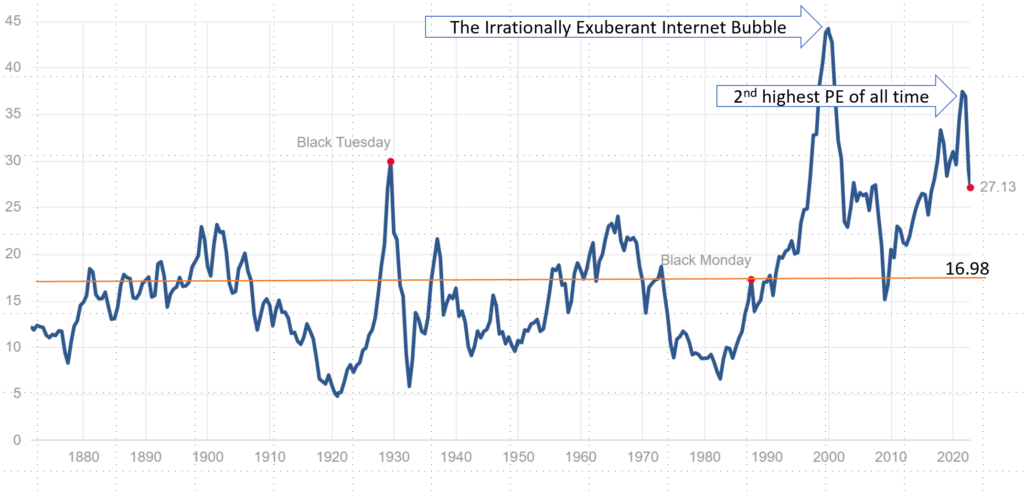
It’s called the Shiller PE ratio (https://www.multpl.com/shiller-pe) and the chart above tracks it back over the last 150 years for the S&P 500. As you can see, at every extreme peak, the multiple drops back to at least its average of 16.98.
The ratio clearly peaked in December, recording the second highest Shiller PE of all time. And reverting back to the long-term average would take the S&P to 2,210 – just above the 2015 high I pointed out at the start.
But again, this assumes earnings stay constant. Combine the effect of a lower premium paid for earnings with less earnings and the peaks of 2018 and 2015 look like mere rest stops on the steep road towards the stock market bottom.
And all I’ve done today just measures the impact of one headwind — negative earnings growth. In my next post, we’ll examine what’s possible for stocks when you factor in rising rates and price instability.
Take What the Markets Give You
P.S. Some say the market is random. But it leaves hints and clues — like those above — if you know where to look.
For more deep analysis, click to join my free Prosperity Pub Telegram channel.
And for those of you who are ready to take action now — by making this bear market work for you, click here to subscribe to The Daily Pick. It’s just $9/month and we’ve closed 23 winners (70% win rate!) in just over 2 months since launching.