JOIN ME LIVE AT 9 AM ET FOR: TECHNICAL TUESDAYS
After the wild swings we’ve seen over the past few trading days, I’ve been laser-focused on one technical level that’s becoming increasingly critical — the 50-day moving average (MA).
However, Monday brought a significant development as the market broke below this key level.
Look, I know Mondays are usually pretty calm, but we just came off two sessions of big-time volatility. The break below the 50-day MA is a concerning sign that the bulls may be losing their grip.
The pattern we’re seeing is becoming impossible to ignore. We were testing the 50-day repeatedly, but now that it’s broken, the market is signaling more potential weakness ahead.
This break could lead to further downside if not quickly reclaimed.
What Today Needs to Deliver
Here’s the thing — today doesn’t have to be super bullish, but it needs to regain the 50-day MA. That’s the new standard we’re measuring against after this breach. If the market can reclaim this level, it would suggest the break was a false move.
I’ve identified two important levels where price needs to stay, the 50-day MA and previous support around 6,742 (SPX). These aren’t just random support zones — they represent the difference between healthy consolidation and something more concerning.

As long as these levels are not offended, we should be pretty good. The question becomes: Can the bulls regain these critical technical levels, and can the bears avoid doing significant damage?
Reading Between the Lines
What I’m really monitoring here is whether we’re in genuine indecision, or if this is the beginning of something more bearish. The break below the 50-day MA suggests the latter, but a quick recovery could change the narrative.
That’s actually a constructive outcome given the volatility we’ve absorbed — the VIX was up more than 15% to just under 23 by Monday’s close. It means the market is working through uncertainty without breaking down structurally.
The repeated testing and now breaking of the 50-day could create some interesting content this week as we see how the market reacts. I’ll be sharing more detailed analysis on this pattern as it develops.
All eyes now are on the 5-day MA and also Nvidia’s (NVDA) earnings after the close Wednesday. If this behemoth stock reports big numbers, it could turn things around. However, we’ve seen several companies get punished even after reporting strong numbers this season…
For now, the message is clear: The 50-day MA is the line in the sand. Everything hinges on whether we can reclaim it.
I’ll see you in the markets.
Chris Pulver
Chris Pulver Trading
Follow along and join the conversation for real-time analysis, trade ideas, market insights and more!
- Telegram:https://t.me/+av20QmeKC5VjOTc5
- YouTube:https://www.youtube.com/@FinancialWars
- Twitter:https://x.com/realchrispulver
- Facebook: https://facebook.com/therealchrispulver
Important Note: No one from the ProsperityPub team or Chris Pulver Trading will ever contact you directly on Telegram.
*This is for informational and educational purposes only. There is inherent risk in trading, so trade at your own risk.
P.S. Small Account? No Problem!
By tapping a unique anomaly in the market studied by Columbia University, Syracuse and even the Federal Reserve…
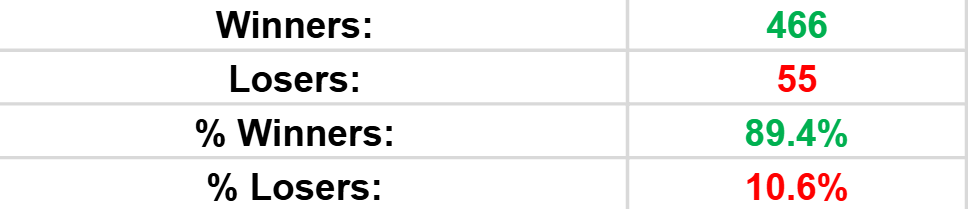
You would have been placing the same trade targeting $100-$150 every day for the last 15 months and landed 400 wins with an 89.4% win rate.
See How To Set up the Trade Here for Free
We develop tools and strategies to the best of our ability, but no one can guarantee the future. There is always a risk of loss when trading. Past performance is not indicative of future results. Stated results are from live published alerts between 8/26/24 and 11/14/25. The win rate has been 89.4% on the options with an average return of 14.87% over a one-day hold time.