The S&P 500 has been stuck for weeks, just chopping around inside that U.S.–China trade gap candle. We’ve got no breakout, no breakdown… yet — though Friday’s action turned pretty bearish
But this is no reason to sit on your hands. For me, this is exactly the kind of environment where I want to build small-risk, high-reward trades using butterflies and traps.
I’ve been trading broken wing butterflies and ironflies around key gamma and liquidity levels — specifically 5,900 and 5,925 on SPX. These are the sticky zones where I want price to pin near the close. If I can get price to settle inside my trap window, I’ll take $470 to $500 all day long.
If it settles a dollar or two off, I still make $100, $200, sometimes $300. It’s cash-settled profit with a max risk of about $30 per trade.
I don’t need to win every one. I size for small risk and build the trade so that even a near miss pays something. And when I hit it clean? That’s a $500 winner without needing a big move — just the right close.
How I Structure the Trade
Everything starts with my pin levels. I define the 5-point windows I want price to land in, and structure around them using 0DTE setups. That means iron butterflies when I want symmetry, and broken wing butterflies when I want a little extra room or cheaper cost.
Either way, I’m placing the short strikes right on the key levels where gamma and liquidity are clustered.
On a good day, price finishes inside the trap and I take max profit. On a near miss, I still make a couple hundred bucks. On a bad day — like when price finishes just outside both ranges — I lose the $30 I risked.
I’ll gladly take that trade-off.
Why It Works in This Market
Sideways price action is ideal for pinning trades. We haven’t broken the highs or the lows, and with time burning off into the close, that opens the door for premium to collapse — which is exactly what these structures capitalize on.
I’m not buying direction. I’m building income.
If I can keep repeating this structure, even just once or twice a week across five accounts, that’s real money. I’m talking $100 to $500 per trade, repeated over and over with defined risk and no directional bet.
That’s how I’m approaching this market. Not waiting for the breakout — which may not even come before a breakdown — but rather trading the chop with precision.
I’ll see you in the markets.
Chris Pulver
Chris Pulver Trading
Follow along and join the conversation for real-time analysis, trade ideas, market insights and more!
- Telegram:https://t.me/+av20QmeKC5VjOTc5
- YouTube:https://www.youtube.com/@FinancialWars
- Twitter:https://x.com/realchrispulver
- Facebook: https://facebook.com/therealchrispulver
Important Note: No one from the ProsperityPub team or Chris Pulver Trading will ever contact you directly on Telegram.
*This is for informational and educational purposes only. There is inherent risk in trading, so trade at your own risk.
P.S. The Pattern That Shows Up Before Explosive Moves
Fundamentals tell one story…
Price action tells the truth —but most traders read it too late. And that’s where the “PinchPoint” comes in.
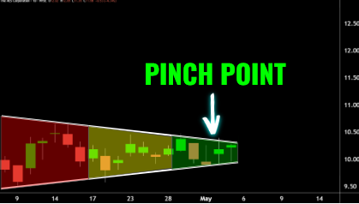
It’s a simple pattern that shows pressure building before a breakout.