🚨 I’ll be live at 9 a.m. ET🚨
We’ll cover some big winners and 10% month in the S&P 500 and nearly 15% in the Nasdaq, plus what’s ahead for May [tap to join us for the Daily Profit Plan]!
Liquidity levels play a critical role in day trading — they’re the foundation for market movement and the key to spotting high-probability setups.
If you’re not paying attention to liquidity, you’re missing a vital piece of the puzzle.
At its core, liquidity represents the ability to enter or exit trades without significantly affecting the market price. High liquidity creates smoother price action and tighter spreads, which is essential for day traders like us who rely on precision.
On the other hand, low liquidity can lead to erratic moves, wider spreads and poor fills — a nightmare when managing tight risk in trades like broken wing butterflies or synthetic strangles.
Liquidity also dictates where the market is likely to gravitate.
Market makers defend key liquidity levels, turning them into magnets for price action. For instance, in a recent SPX trade, I used these levels to identify a probable price range. Sure enough, the market hovered around my identified zone, allowing my trade to settle profitably.
The Stabilizing Effect of Zero-Day Options
Since the introduction of zero-day-to-expiration (0DTE) options in 2022, liquidity has become even more concentrated around specific price levels. These short-term instruments provide big players with new hedging tools, adding extra volume and stabilizing market movements.
As a result, we’ve seen fewer large intraday swings — those four, five or six percent moves that used to dominate the S&P 500 and Nasdaq are less frequent.
Instead, the market has become more controlled, trading in fractions of a percent. For traders like us, this creates an environment where defined-risk strategies can thrive.
Whether it’s a broken wing butterfly or a Waterfall trade, understanding where liquidity pools exist can significantly improve your odds of success.
How to Incorporate Liquidity into Your Trading
To leverage liquidity levels effectively, keep these steps in mind:
- Identify Market Maker Defenses: Tools like liquidity heatmaps or volume profiles can highlight zones where institutions are likely to defend positions.
- Focus on High-Volume Areas: Avoid low-volume regions where price can move unpredictably. Instead, position trades near established liquidity zones.
- Adapt to Changing Conditions: Liquidity is dynamic — it shifts with news, earnings and economic data. Stay flexible and adjust your strategy as conditions evolve.
- Time Your Trades: Liquidity tends to peak during key trading hours, like the open and close. Use these windows to enter or exit positions with tighter spreads.
Day trading without understanding liquidity is like flying blind.
By focusing on liquidity levels — and using tools like 0DTE to your advantage — you can create consistent, defined-risk trades that align with the market’s natural rhythms. Keep an eye on these levels, stay disciplined, and let the market come to you.
Now go crush it — and don’t forget to keep cash ready for those high-probability setups!
I’ll see you in the markets.
Chris Pulver
Chris Pulver Trading
Follow along and join the conversation for real-time analysis, trade ideas, market insights and more!
-
- Telegram: https://t.me/+av20QmeKC5VjOTc5
- YouTube: https://www.youtube.com/@ChrisPulverTrading
- Twitter: https://x.com/realchrispulver
- Facebook: https://facebook.com/therealchrispulver
*This is for informational and educational purposes only. There is inherent risk in trading, so trade at your own risk.
P.S. You’ve Got To Check This Out!
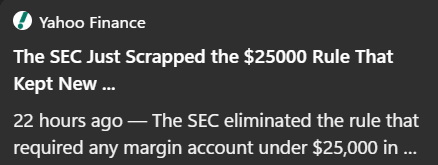
The SEC has agreed to eliminate the pattern day trading rule…
And it’s supercharging my No. 1 day trading strategy.