JOIN ME LIVE AT 9 AM ET FOR: TRENDING THURSDAYS
I’ve been digging into some fascinating technical patterns on gold lately, and what I found should make every precious metals investor sit up and pay attention.
Gold is approaching a danger zone I haven’t seen since the last major precious metals bubble — and the warning signs are flashing red.
We’re creeping up on 500 bars above the 200-day moving average, which puts us in extremely rare territory. You rarely see assets do this — it’s a statistical anomaly that screams caution.
The 2009-11 Parallel That Should Worry You
Here’s what makes this situation so concerning…
We had over 600 bars in the two-year period from 2009 to 2011 where gold went above the 200-day moving average and did not hit it.
That historic run ended badly. Very badly.
When gold finally topped out from that extended move, investors who didn’t take profits got crushed in the correction that followed. The market has a way of punishing extreme stretches like this, and gold is no exception.
Eventually, when this ridiculous rip on gold is going to top out, we’re going to see a pretty nasty correction, probably back down to the 200-day moving average. I’m talking about a 25-30% correction in a nasty fashion when this thing finally breaks.
What This Means for Your Portfolio
Look, I’m not calling a top here — timing these extreme moves is nearly impossible. But I am saying the risk-reward equation is shifting rapidly.
If you’re holding gold positions, this is the time to start thinking about trailing stop losses. When gold goes toppy and comes back down in a blaze of glory, investors left holding the bag will regret not taking profits.
The smart money recognizes when assets become dangerously stretched. Depending on how aggressive gold runs, I’m being cautious of one thing — this window as a correction is probably going to get hit.
Don’t let a great run turn into a devastating loss. The 500-bar warning is real, and history rarely lies about these extreme technical conditions.
I’ll see you in the markets.
Chris Pulver
Chris Pulver Trading
Follow along and join the conversation for real-time analysis, trade ideas, market insights and more!
- Telegram:https://t.me/+av20QmeKC5VjOTc5
- YouTube:https://www.youtube.com/@FinancialWars
- Twitter:https://x.com/realchrispulver
- Facebook: https://facebook.com/therealchrispulver
Important Note: No one from the ProsperityPub team or Chris Pulver Trading will ever contact you directly on Telegram.
*This is for informational and educational purposes only. There is inherent risk in trading, so trade at your own risk.
P.S. SEC Filings Come 45 Days Too Late
Your entire trading setup could be to find what Wall Street insiders are doing … and do the very same.
But there’s a problem with this approach.
Most people try to do this by digging through SEC Form 4 filings.
That’s a good try… But those filings are often published up to 45 days after the trades actually take place.
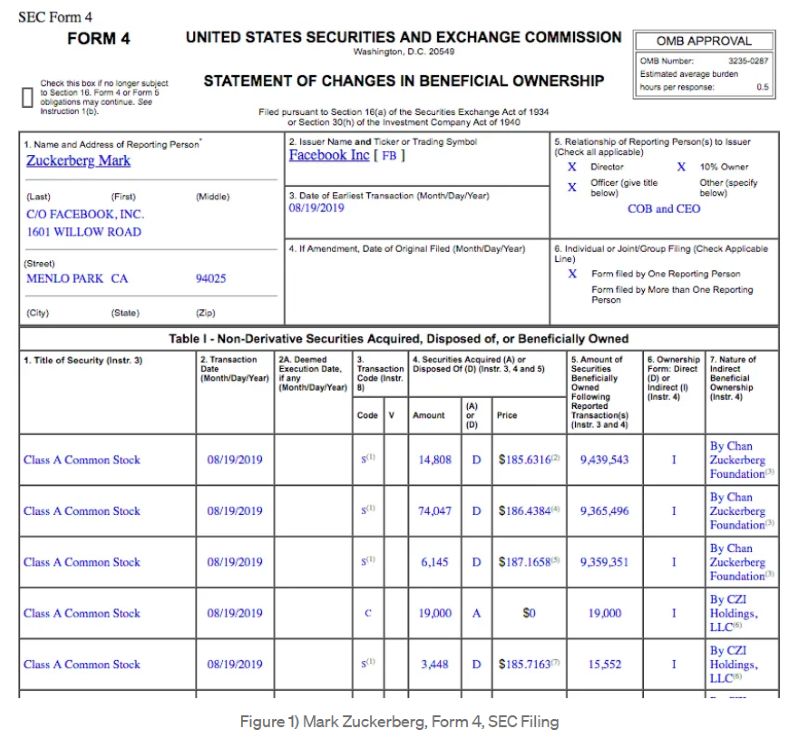
By then, the insiders have already made their move, and the profit opportunity has passed you by.
That’s why I use something faster called “Liquidity Levels” to follow Wall Street money in real time.
These levels are specific price areas that act as magnets for Wall Street’s large, undercover buy orders.
As price reaches for these levels, 24-hour cash opportunities open up for savvy traders to target double returns by the next day.
And thanks to a piece of trading tech most people have never heard of…
Anyone can now spot and take advantage of these Liquidity Levels.
I’ve been using it to land regular payouts on the SPY.
But these 24-hour opportunities open up every day on some of your favorite stocks.
And although I can’t make reckless guarantees when it comes to the market…
If you’d like to see how you can begin leveraging them on your own – without any help…