JOIN ME LIVE AT 9 AM ET FOR: MACRO MONDAYS
We start the week looking at the market from the top down. I’ll walk through the major indexes, economic themes, currencies and internals like advanced-decline lines and breadth. The goal is to set expectations for the week ahead and identify directional bias before the real trading action begins.
I’ve been staring at the same chart all week, and I’ve got to tell you — there’s a critical level sitting right beneath us that every trader needs to be watching.
The market basically did nothing last week…
We’re talking about five days of trading that have moved roughly 50 points to the upside with little to no real direction outside of maybe one daily trading range. But don’t let that quiet consolidation fool you — the S&P 500 (SPX) 6,550-6,565 zone is the line in the sand that really should not see any damage below it.
When markets stall like this, they tend to show their discomfort, and lately they’ve been acting like they hate indecision. There’s a sense of uncertainty running through every session, and the price action keeps pulling me back to this recent look that continues to form around support.
Here’s what caught my attention — If the bears manage to take out these lows, we’re not just talking about a minor pullback. We’re looking at a legitimate correction pattern that could reshape the next few months of market action.
Two Patterns, Same Destination
If we break below 6,550, there are two potential bearish patterns that could activate — either a head-and-shoulders formation or a double-top pattern. Both of them measure out to roughly the same downside target, which is what makes this setup so compelling from a risk management perspective.
The move from either pattern potentially puts us back into correction territory around the 6,100 level, and it could even overshoot down to the 6,000 area if momentum accelerates.
That’s approximately a 10% correction from current levels — not catastrophic but certainly enough to flush out weak hands and create real opportunity.
Now, the head-and-shoulders scenario would measure the symmetry from the recent structure we’ve built. But there’s also a chance this market creeps back up to test the highs one more time before turning over, which would complete the double-top pattern instead.
Either way, we’re looking at the 6,145-6,150 zone as the previous all-time highs that could serve as downside targets.
How I’m Positioning for This Setup
Despite the bearish technical setup, I’m not running for the hills here…
In fact, I’d still be a dip buyer if we get that pullback — or at the very least, I’d be selling premium into any weakness.
My game plan involves using Fibonacci retracements to identify specific reentry zones. I’m looking at the 38% to 61% Fibonacci retracement levels as potential bounce areas where I’d consider getting more aggressive on the long side.
If we pull back to those zones and find support, I’d be looking for a move back to the highs, if not higher.
The broader picture still offers two distinct scenarios. Either the market is trying to push back to all-time highs or higher — with 7,000 being an attractive spot — or we get a pullback first to reset sentiment and create better risk-reward entry points.
Look, the market has been remarkably quiet lately, consolidating in a tight range. But that consolidation is happening right at a structurally important level.
The decision point is here, and how price behaves around the critical 6,550 zone will determine whether we get another leg higher or finally see that correction so many traders have been waiting for.
The beauty of this setup is that it gives us a clear line in the sand…
Above 6,550, the bulls remain in control and we’re likely headed back toward all-time highs. Below it, we activate a measured correction pattern with defined downside targets that create opportunity for strategic dip buying.
I’ll see you in the markets.
Chris Pulver
Chris Pulver Trading
Follow along and join the conversation for real-time analysis, trade ideas, market insights and more!
- Telegram:https://t.me/+av20QmeKC5VjOTc5
- YouTube:https://www.youtube.com/@FinancialWars
- Twitter:https://x.com/realchrispulver
- Facebook: https://facebook.com/therealchrispulver
Important Note: No one from the ProsperityPub team or Chris Pulver Trading will ever contact you directly on Telegram.
*This is for informational and educational purposes only. There is inherent risk in trading, so trade at your own risk.
P.S. Can You Spare a Few Minutes Every Monday At 11:59 AM?
That’s when I leverage a special niche in the options market to place a specific trade on one ticker to target “Weekly Windfalls.”
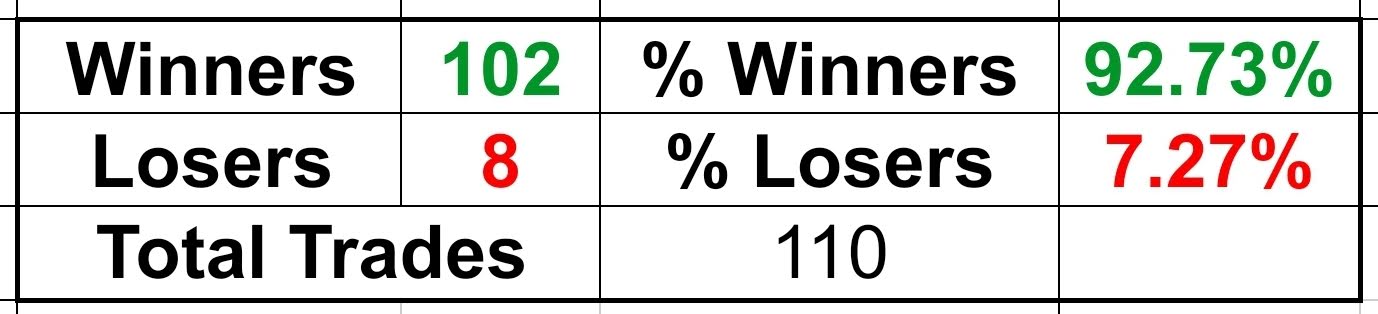
This same approach has delivered a 92.7% win rate on LIVE trades.
Want to see how you can target extra income every week?
We develop tools and strategies to the best of our ability, but no one can guarantee the future. There is always a risk of loss when trading. Past performance is not indicative of future results. From 9/30/24 – 11/07/25 on live trades the win rate is 92%, 16.5% average return, with an average hold time of 12 days.