🚨 I’ll be live at 11:30 a.m. ET🚨
We’ll look for new income trades, manage assignments and more [tap to join us for Market Masters]!
I’ve been getting questions lately about Elliott Wave analysis, so let me walk you through exactly how I use it in real time to make trading decisions.
Here’s the thing about Elliott Wave — it’s not some mystical crystal ball. It’s a framework for reading what the market is doing right now and, more importantly, what it’s likely to do next. The key is knowing which patterns to watch and what they’re telling you about the next move.
Recently, I was watching a setup with a clear wave-one and wave-two count, but the internal structure showed waves one, two and three and probably needed waves four and five to bottom out.
That’s when things get interesting because the next move becomes the tell.
The Critical Difference Between Three-Wave and Five-Wave Structures
If the next move has a three-wave structure and stops at a lower high, that signals continuation downward. The market probably isn’t done falling yet.
But if we get a five-wave structure that approaches or breaks through the previous high, that tips the scales toward a short-term move higher, whether it unfolds over the next couple of days or just a few hours.
This isn’t theoretical. As I analyzed this pattern, the Nasdaq 100 (QQQ) was already down about 0.5%. The S&P 500 (SPY) wasn’t down much yet, but the structure suggested the decline could easily extend. That’s the risk you’re managing when you’re positioned near a potential reversal zone.
I also spotted what could be five waves down followed by a substantial three-wave retracement to the 61.8% Fibonacci level, with room to fall further. Some people argue that Fibonacci levels have no statistical meaning.
I don’t treat them as guarantees. I use them as reference points that become more useful when price structure, wave counts and market behavior line up around the same area.
Why Confirmation Matters More Than Prediction
One of the most important Elliott Wave signals is overlap. It’s not enough to see price briefly enter a level — I want confirmation that the count has actually been invalidated.
In this case, price spiked into a potential overlap zone, but no candle closed there. That’s a critical real-time distinction. A temporary move can look convincing while it’s happening, but without closing confirmation, the bearish count remains intact.
The drop also didn’t feel final because price was still making a lower high. That kept me cautious about calling a bottom too early.
Elliott Wave isn’t about being right 100% of the time, and neither are Fibonacci levels. They’re tools for reading probabilities and recognizing when the odds shift.
When you understand the difference between a three-wave correction and a five-wave impulse, then wait for confirmation instead of anticipating it, you gain a clearer framework for deciding whether to stay in or get out before the next leg down.
The market gives you clues constantly. You just need to know which ones actually matter.
Jeffry Turnmire
Jeffry Turnmire Trading
I host my Morning Monster livestream at 9:15 a.m. ET each weekday on YouTube, and then 30 Minutes of Awesome at 5 p.m. ET each Tuesday!
Please check out my channel and hit that Subscribe button!
You can also follow along and join the conversation for real-time analysis, trade ideas, market insights and more!
- Telegram:https://t.me/+6TdDE7-F6GlhMmJh
Important Note: No one from the ProsperityPub team or Jeffry Turnmire Trading will ever message you directly on Telegram.
I’m just a regular dude in Knoxville, Tennessee: a husband, father, civil engineer, urban farmer, maker and trader.
I’ve been at this trading thing with real money for 20-plus years, and started paper trading over 35 years ago. I have a knack for making some epic predictions that just may very well come true. Why share them? Because I like helping other people — it’s the Eagle Scout in me.
*This is for informational and educational purposes only. There is inherent risk in trading, so trade at your own risk.
P.S. 1% a day? This Kind of Consistency Should NOT Be Possible
The daily tactic I’m about to show you is arguably the most consistent setup I’ve ever come across…
Over 172 trades and counting without a single loss, all because I’ve struck upon one of the market’s most consistent daily patterns.
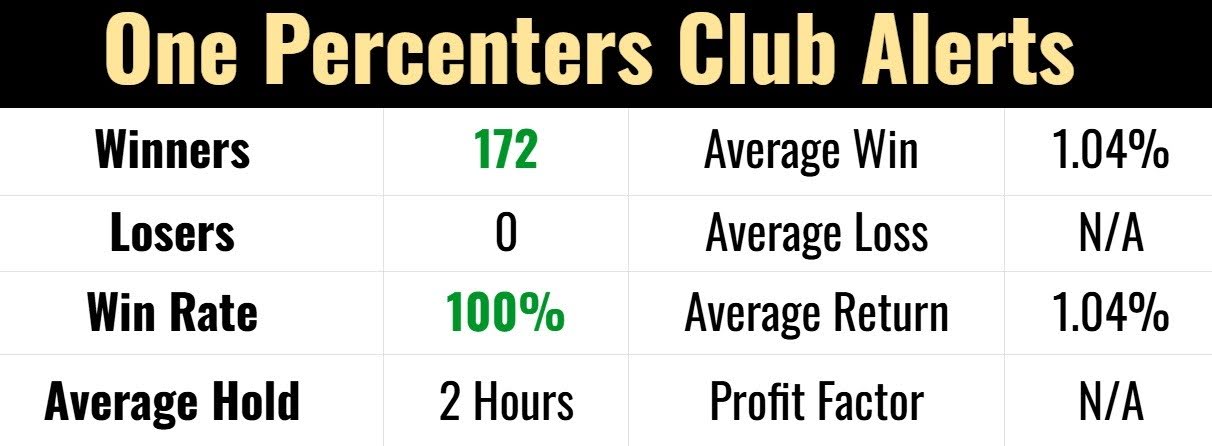
We develop tools and strategies to the best of our ability but no one can guarantee the future.There is always a risk of loss when trading, and past performance is not indicative of future results. From 10/9/25 – 6/29/26, on 172 live trades taken with real money, the win rate is 100%, 1.04% average return, with an average hold time of less than 2 hours.