🚨 I’ll be live at 10 a.m. ET with Nate Tucci🚨
[tap to join us for Opening Playbook]
Look, I get it — the market feels rough right now. The chop is real, the drawdowns are frustrating and it’s easy to wonder if things are ever going to really turn around.
And part of what makes this period so challenging is how catalyst-driven everything has become. Headlines are whipsawing sentiment, moves are sharp and short-lived and it can tempt even disciplined traders to jump to conclusions.
This is exactly when patience matters most, because the noise makes it easy to mistake volatility for a deeper correction that hasn’t fully confirmed itself yet.
But here’s what I’ve been digging into lately, and it’s telling a story that’s hard to ignore.
When I layer together the presidential cycle, the Fed cycle and even comparisons to the dot-com boom, they all converge on the same conclusion — we’re entering a historically strong seasonal window that typically runs from March through May.
I’m not saying it’s a guaranteed moonshot. But when multiple independent patterns all point in the same direction, I pay attention.
The Presidential and Fed Cycles Are Lining Up
Let me break down what I’m seeing.
The presidential cycle typically bottoms in late February or early March. The Fed cycle — especially for a new Fed chairman — shows the same pattern, with a bottom around the same time frame.
And when I look at the S&P 500 over the last 20 years, markets typically bottom in March and then show strong bullish performance afterward.
Now, I’d be lying if I said this was exact science. Last year, tariffs hit in March and the market didn’t actually bottom until April. So don’t take this as a precise calendar date. But the pattern is consistent enough that it gives me a framework to work with.
Looking at the presidential seasonality specifically, January and February are weak periods — and that’s exactly what played out this year. But March, April and May? Very bullish, historically speaking.
The Fed cycle chart shows a similar bullish window opening up that extends through July. That’s not a short-term blip — that’s a multi-month setup.
The Dot-Com Comparison Adds Another Layer
Here’s where it gets even more interesting.
I’ve been tracking the current AI boom against the dot-com era starting from the launch of Netscape. And what I’m seeing is that we’re currently at a point in the pattern that corresponds to a lot of chop and drawdown — a small cool-off phase.
Sound familiar?
But here’s the thing — in the dot-com era, this consolidation phase was followed by three months of a nice run higher, with Nasdaq climbing between 20-30% during that stretch.
Now, I don’t think we’ll necessarily see those exact returns. But the pattern suggests that this period of consolidation is typically followed by a bullish move.
And I do expect that.
Another important piece of the puzzle is sector behavior. Some of the least exciting areas of the market on the surface are actually showing the strongest setups under the hood. Utilities (XLU), for example, has quietly been one of the best-performing sectors both seasonally and right now.
When defensive sectors start leading into a seasonal turn, it often signals underlying stability that can support broader risk-on behavior as conditions improve.
That’s why I like keeping an eye on where relative strength is emerging. It helps confirm whether these seasonal windows are aligning with real market participation — not just theoretical patterns.
And through all of this, risk management still matters. None of these cycles, patterns or comparisons override the basics. You never trade with money you cannot afford to lose, especially in a market this headline-driven.
Strong seasonal setups can tilt probabilities, but they don’t eliminate uncertainty. Position sizing, stops and discipline are what keep you in the game long enough to take advantage of moves when they finally materialize.
The beauty of this analysis isn’t that any one chart tells the whole story. It’s that multiple seasonal patterns — presidential cycle, Fed cycle and historical comparisons — are all pointing toward the same thing.
This is the kind of convergence that gives me confidence. Not certainty, but confidence.
So if you’re feeling beaten down by the current market action, I get it. But hang in there. The seasonal setup ahead is one of the strongest we see all year — and it’s opening up right now.
Graham Lindman
Graham Lindman Trading
Follow along and join the conversation for real-time analysis, trade ideas, market insights and more!
- Telegram:https://t.me/+abM5RWRJKrpkNWI5
- YouTube:https://www.youtube.com/@NewMoneyCrew
Important Note: No one from the ProsperityPub team or Graham Lindman Trading will ever contact you directly on Telegram.
*This is for informational and educational purposes only. There is inherent risk in trading, so trade at your own risk.
P.S. Access the Lotto Board’s Top 3 Picks for Today!
Thanks to an algorithmic pricing error, the Lotto Board is able to filter options contracts that are massively underpriced.
It floats the top 3 most likely to give us a shot at a payout worth 50%, 100% and even more in a few days.
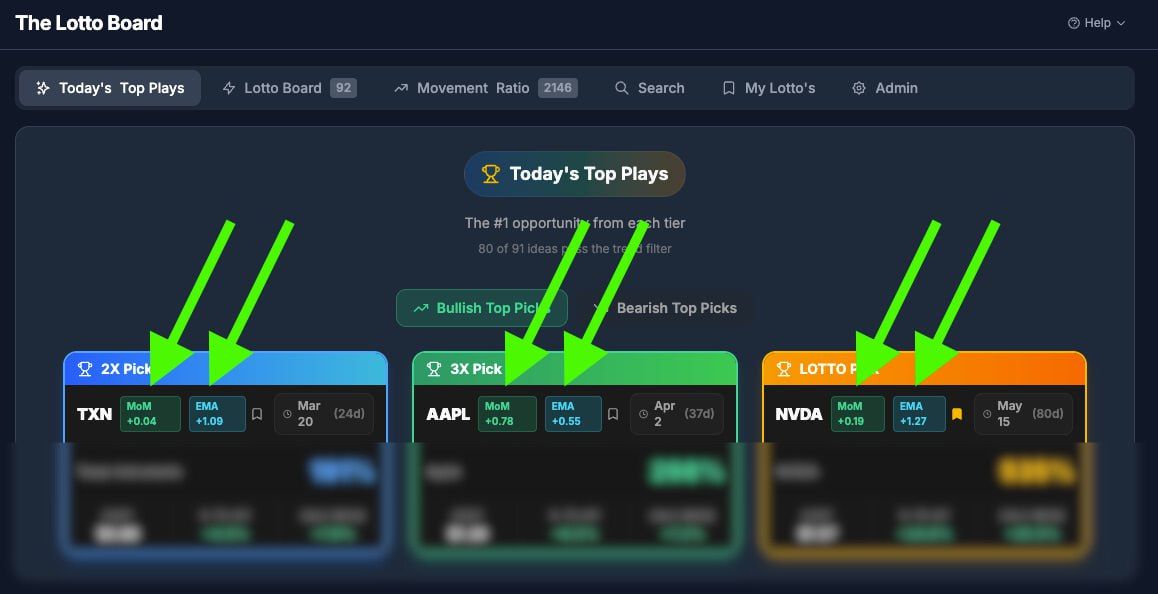
I can show you the top 3 it’s floating now, as well as how you can access the entire board today.