>>>I’ll be live with Jack Carter at 11:30 AM ET for Market Masters — we’ll cover current trends and trades, actionable opportunities, trading education and more, CLICK HERE TO JOIN!<<<
Google parent Alphabet (GOOGL) is breaking out, and $337 is the next upside target. This move is not just technical. It is tied to a structural shift that most traders are overlooking.
While the market watches the AI race through the lens of Nvidia (NVDA), Google has been building something far more important. After a decade of development, its TPU chips are finally becoming a clear competitive edge, and that strength is starting to show up in the chart.
Google Cloud is the only major provider that can deliver top tier AI performance without relying on Nvidia margins. Amazon (AMZN) and Microsoft (MSFT) must buy Nvidia hardware at premium prices. Google does not.
That freedom lets Google undercut competitors on price or keep the extra margin. Either path is powerful. This is what true moat building looks like in the AI era — owning the full stack and controlling your cost structure.
The TPU line is already on its seventh generation, giving Google a massive head start while others are just beginning to invest in custom chips. That advantage becomes more important as AI workloads scale.
The breakout aligns cleanly with the fundamental story. If momentum holds, 337 is the next logical target. Google’s margin advantage and long lead in custom AI silicon support the move.
This is one of the strongest big tech setups right now. Keep it on your radar.
Tesla’s Corrective Pattern: Waiting for One More Dip Before the Next Run
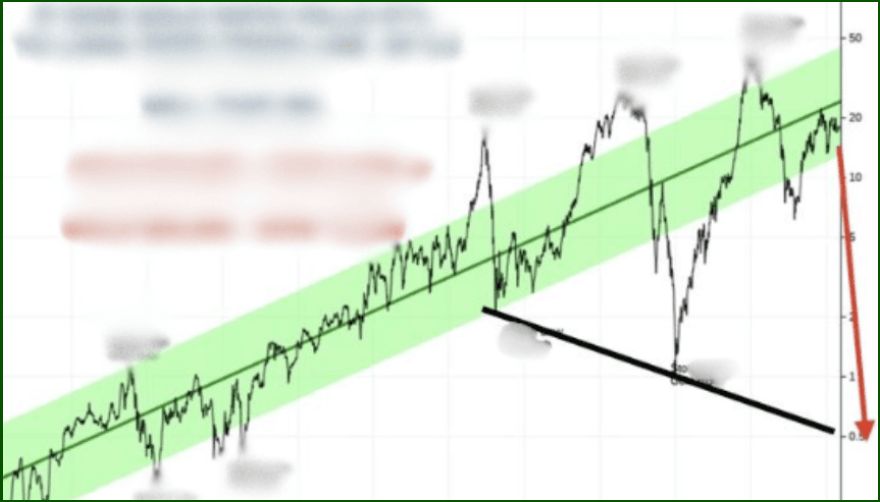
Tesla (TSLA) has been moving in a way that confuses a lot of traders, but the chart is forming a clean corrective structure. The stock’s had a strong week, but longer-term price movement looks like a textbook A-B-C correction that still needs one more dip before the trend can resume.
This is not the moment to rush in. The pattern needs to complete before a higher probability setup appears.
The bigger trend has been up. The recent pullback is the corrective phase and the next move should continue the earlier uptrend. Strong trends move higher, pull back to reset momentum then continue.
Tesla appears to be in the middle of that reset. A simple three-point tool shows how the bounce fits neatly within an A-B-C corrective shape. Trend is down and continuation is down, which is exactly what trend pullback continuation traders look for.
Some of the choppiness comes from the broader market. The S&P 500 (SPY) recently formed a big head and shoulders look that threatened a breakdown but then rejected level after level in messy fashion.
That chaos makes Tesla’s orderly correction stand out even more.
The chart still suggests one final move lower would complete the corrective structure. That dip is the missing piece. Once it plays out, the setup for a push higher becomes more attractive.
These patterns are common in strong stocks, especially when tech is evolving fast. Even in AI, advances like the latest TPU — reportedly on par with Nvidia’s best Blackwell chips — show how quickly performance is accelerating.
Those innovations often spill into areas Tesla touches.
Buying too early risks getting caught in that last leg down, so patience matters. Tesla continues to hold up well, which supports the idea that this is a normal pullback, not a breakdown.
When the final dip completes the pattern, the stock should be positioned for its next move higher. For now, the disciplined play is to wait for the pattern to finish. The setup is close — it just needs a bit more time.
Jeffry Turnmire
Jeffry Turnmire Trading
I host my “Morning Monster” livestream at 9:15 a.m. ET each weekday on YouTube, and then “30 Minutes of Awesome” at 5 p.m. ET each Tuesday!
Please check out my channel and hit that Subscribe button!
You can also follow along and join the conversation for real-time analysis, trade ideas, market insights and more!
- Telegram:https://t.me/+6TdDE7-F6GlhMmJh
Important Note: No one from the ProsperityPub team or Jeffry Turnmire Trading will ever message you directly on Telegram.
I’m just a regular dude in Knoxville, Tennessee: a husband, father, civil engineer, urban farmer, maker and trader.
I’ve been at this trading thing with real money for 20-plus years, and started paper trading over 35 years ago. I have a knack for making some epic predictions that just may very well come true. Why share them? Because I like helping other people — it’s the Eagle Scout in me.
*This is for informational and educational purposes only. There is inherent risk in trading, so trade at your own risk.
P.S. WARNING: The Data Unfolding Right Now Is Disturbing!
I’m raising a major red flag on the economy – and this isn’t hyperbole.
The data flashing across my screen looks disturbingly similar to the early warning signals we saw in 2020…
And if those patterns are repeating, we may be on the front edge of something far more serious than a recession.
Call it what you want – a severe downturn, a systemic break, even the early stages of a modern depression – but the warning signs are stacking up fast.
Now, this isn’t a “doom headline” with no direction.
Because every major crisis in the past century has delivered one thing consistently:
A massive, generational opportunity in Gold.
Back in 2020, when these same signals started to flash, I used this exact roadmap to turn a $250k account into $1.4 million.
And if this setup plays out again, Gold’s path to $10,000 is mathematically reasonable.
No guarantees on the market, of course – there never are.
But if the market cracks the way I believe it might, sitting on the sidelines won’t protect you… and it certainly won’t help you profit from the shift.
That’s why I’ve laid out the full game plan… how to position defensively and how to capitalize if the coming move accelerates.
If You Want the Roadmap, It’s Right Here
We develop tools and strategies to the best of our ability, but no one can guarantee the future. There is always a risk of loss when trading past performance is not indicative of future results. All examples shown today are based on a $2,000 starting stake unless otherwise stated. 11/22/2023 – 11/12/2025 on live trades the win rate has been 70.4% with an average return of 19% (winners and losers) with an average hold time of 3 days.