They say the markets climb a wall of worry, and boy did 2021 give it plenty of footholds.
The traps of WWIII seem to have been set in Taiwan and Ukraine.
Containers piled up sky-high in ports while lines of ships stretched well past the horizon.
Shelves laid bare.
Energy costs soared — heck, the price of nearly everything soared.
And waves of Greek-labeled COVID-strains swept the globe while President Biden did all he could to make it harder for people clinging desperately to the right to choose to earn a living.
Despite all this worrisome noise, the S&P 500 still managed to post the third-highest annual return this century, ending the year up nearly 27% into record territory yet again. Which, understandably, has led to cries of “overvaluation” and “eminent market crash.”
But noise is just that — noise. It clouds our vision. It limits our perspective.
And when I need to broaden my perspective, facts are the first place I look…
Fatter Margins, Less Cost
Higher stock prices need profits to justify them.
And over the last six years, the S&P 500 companies have taken profits (as measured by economic profits) from $272 billion per month to just shy of $800 billion dollars.
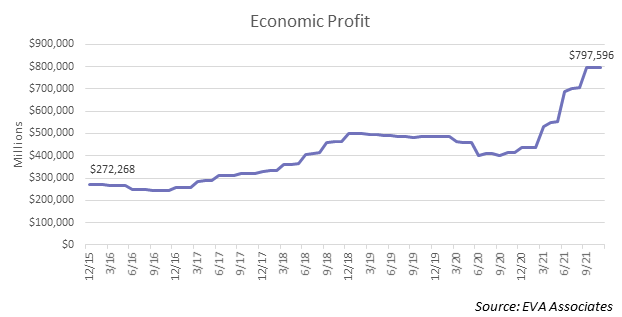
That’s a nearly 3-fold leap in absolute profits. And most of that gain piled up on the bottom line of S&P 500 companies over the last 12 months.
And while surging sales explain some of the gain — revenue has grown 38.5% over that same time frame – the real driver of profitability boils down to two powerful factors, operating efficiency and lower capital costs.
-
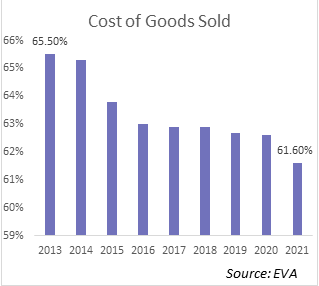
In 2013, companies spent an average of 65 cents out of every dollar they earned to build the products and services they sell. But since then, those costs steadily declined and now amount to only 61 cents per dollar of revenue.
Meanwhile, tax burdens have also declined.
Over the last decade, effective corporate tax rates have fallen from 25% in 2012 to just over 18% last year.
Now, a 4-percentage point drop in costs and 7-percentage point drop in taxes may not seem like much. But when we’re talking $11.3 trillion in sales, or well over half of U.S. GDP, those efficiency gains can add up.
But the real tailwind propelling profitability forward results from the fact that raising the capital required to generate profits doesn’t cost nearly as much as it once did.
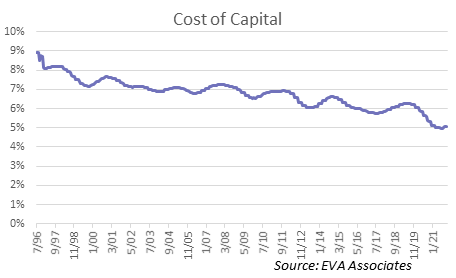
For the last 20-plus years, the cost of capital has marched relentlessly lower.
In 1996, raising capital through equity and debt cost companies just shy of 9%.
But between a steady decrease in equity market risk and lower interest rates thanks, in part, to easy monetary policy, you can measure that cost at 5%.
Now, the reasons for this are complex. I’ll explore the drivers of this trend in more detail on Friday. But, at the end of the day, companies today achieve more with less.
And that’s bullish for stock prices.
But there’s one more metric that I want to share with you that, while not screaming “Stocks on Sale,” remain a far cry from the “Irrational Exuberance” levels of the late 90s.
Price versus Earnings Provides Only Part of the Picture
When equity analysts say “rich” or “overvalued,” they typically point to price-to-earnings ratios (P/E multiples).
In fact, it was Robert Shiller’s book Irrational Exuberance, first published in 2000, that truly set the notion of P/E multiples as a valuation metric in the minds of investors.
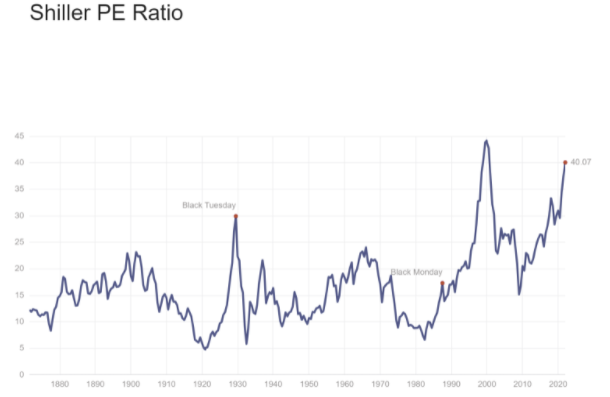
And, based on this same metric (you can find the Shiller PE Ratio graph, above, at https://www.multpl.com/shiller-pe), the market does look significantly overvalued.
But this measure of value ignores two critical pieces of the puzzle.
First, it says nothing about the capital costs required to generate these earnings, so it doesn’t reflect true profitability. Second, it doesn’t put the profits that companies earn in the context of the capital used to generate profits.
Well, I don’t want to make the same mistake.
Capital markets have evolved tremendously over the last two decades. Intellectual property now rules where brick and mortar once held sway. And with disruptive, capital-light business models the name of today’s wealth-building game, you need to put profits, market value and capital all in context.
And the most comprehensive measure I know of is Future Growth Reliance.
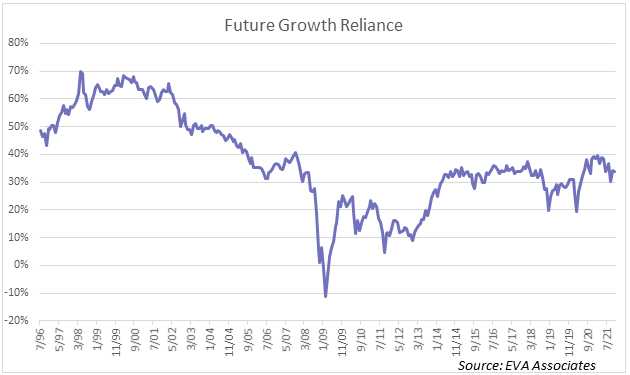
Future Growth Reliance compares a company’s equity market value (in this case, the equity market values of all companies of the S&P 500) to current profitability levels and capital investments. The difference is called Future Growth Reliance and gives you a sense of how much more you’re paying for a stock above and beyond current profits and capital.
As you can see, while the S&P isn’t as cheap as it was in the depths of the Great Financial Crises, it’s still a fry cry from heady days of the internet bubble.
So, while there’s plenty to worry about in the world today — 2022 could be as fertile a ground for worry as the last two years – I hope this perspective helps you see that excessively rich equity market values aren’t one of them.
And to dig even deeper into the current state of stocks after a breathless 2021, I recently held a live Deep Dive on the S&P 500 for the Prosperity Pub Community over in the Telegram messaging app. I discussed these points, plus also addressed concerns about narrow market breadth.
It was recorded, so head on over to Telegram to check it out (you don’t have to scroll back far to find it).
P.S. Looking for some guidance getting started with Telegram so you can watch the Deep Dive referenced above? Just click here to grab the guide we put together for you.