Speaking of stocks that have shown strong recent momentum and are now trading in a tight channel (we talked about LEN on Tuesday), we see the same thing now on Owens Corning (OC).
Since October, OC has been showing strength, reversing upward to new highs in December.
During January, though, it’s taken a slight breather and has gone sideways.
Here’s the chart:
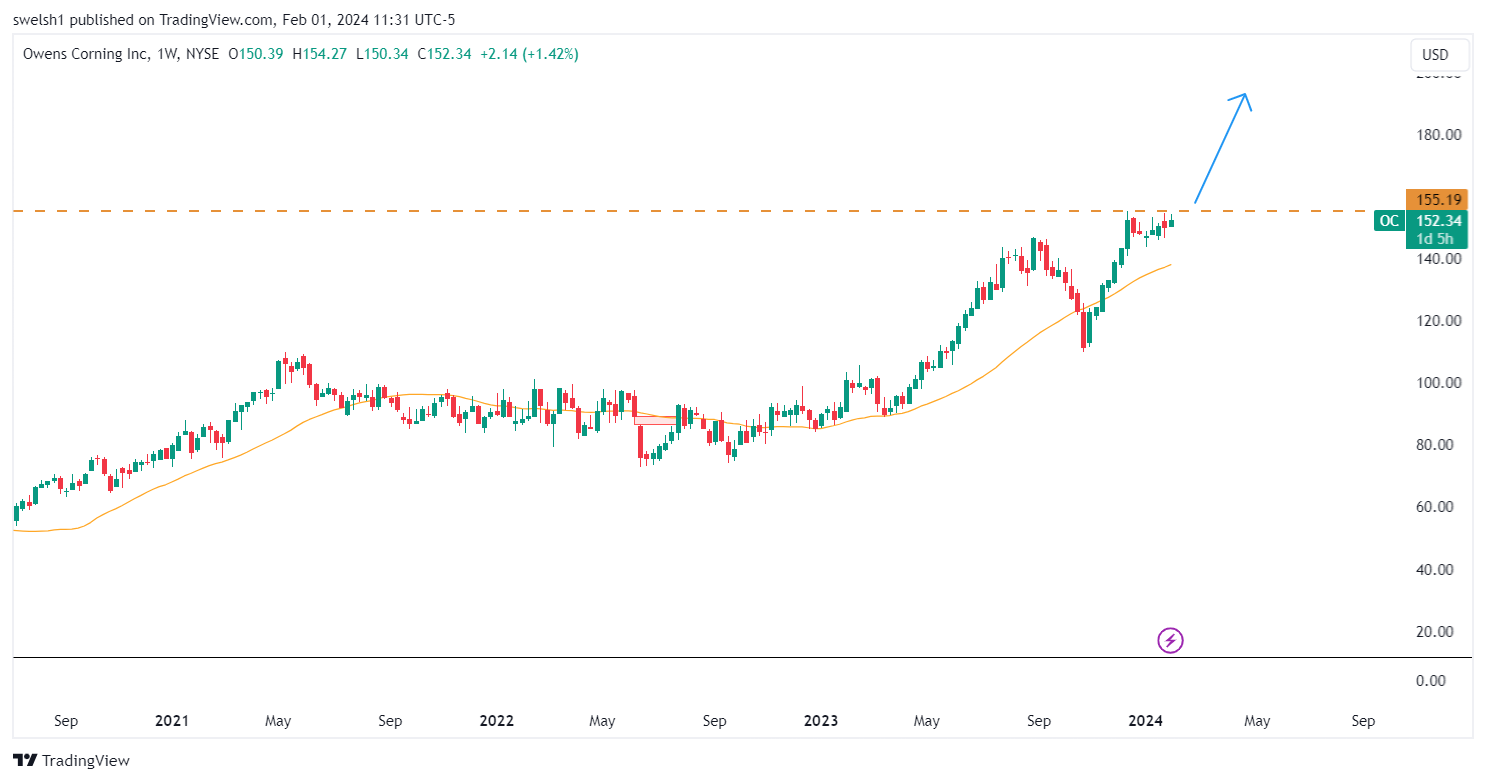
OC is in a very hot sector and a break above $155.19 could lead to a big move.
We’ll keep an eye on it.
Happy trading,
— Scott Welsh
P.S. As a reminder, these plays are based on my longer-term Weinstein Stage Analysis method. The chart above uses weekly candles and a 30 week simple moving average. For details on this method, see my explanation on this Ask The Pros episode starting at timestamp 20:45.