🚨Opening Playbook is live at 10:30 a.m. ET🚨
We’ll cover Gap Opportunities with me leading the charge [tap to join us for Opening Playbook]
Something weird is happening in the market right now.
You’re seeing big moves. Huge daily ranges. Overnight gaps. Candles that look aggressive and decisive.
But when you zoom out, we’re still going nowhere.
It’s what I’ve been calling an expanding corrective structure — and if you’re not careful, it’ll trick you into thinking we’re trending when we’re really just chopping louder.
Here’s what I mean.
The Market Is Getting Louder, Not Clearer
Look at the S&P 500 Index (SPX) daily chart over the past few weeks. We went from tight consolidation candles to bigger candles with more overnight gaps. The action feels more intense. Volume’s up. Individual days are moving fast.
But we’re getting a lot of average true range expansion without much net average true range expansion.
Translation? The sideways market is expanding, but it’s not breaking into a trend. This isn’t just ordinary chop anymore. It’s a broader corrective structure with an increasingly wide range — and we’re still bouncing around inside it.
That distinction matters because larger swings can create the perception of momentum.
A sharp move toward one edge of the structure may look like the beginning of a breakout, only to reverse before producing meaningful follow-through. Traders can end up chasing visual drama instead of reading the underlying structure.
One recent session had a massive-looking candle, yet the following day’s move from open to close was much bigger even though its candle looked less dramatic.
That’s the kind of environment we’re in: Plenty of visual noise but not much net progress.
What Do You Do With This?
First, recognize that this may not be random chop. Once the pattern has persisted long enough, calling it an expanding corrective structure gives you a framework for anticipating how price may behave.
That framework changes your expectations. Instead of assuming every large candle will produce continuation, you expect the possibility of another reversal within the range.
You can then separate genuine directional movement from volatility that only makes the correction look more important than it is.
Second, adjust your approach. Don’t assume every big candle is the start of a new trend or that a wild session will lead to follow-through.
Individual days are moving a lot, with heavy volume and quick swings, but the overall market still hasn’t chosen a direction.
Plenty of traders think that if the rate hike didn’t maintain downside, nothing will — and the market is ready to move higher. Maybe they’re right. Maybe we’re done correcting and ready to rip.
But until SPX breaks out of this structure, I’m treating the market for what it is: an expanding corrective market. Bigger swings, sure. But still corrective.
The key is not getting fooled by the size of the moves. It’s understanding the structure behind them.
Nate Tucci
Tucci Trades
Follow along and join the conversation for real-time analysis, trade ideas, market insights and more!
- Telegram: https://t.me/nate_tucci
- YouTube: https://www.youtube.com/@NewMoneyCrew
Important Note: No one from the New Money Crew team or Tucci Trades will ever contact you directly on Telegram.
*This is for informational and educational purposes only. There is inherent risk in trading, so trade at your own risk.
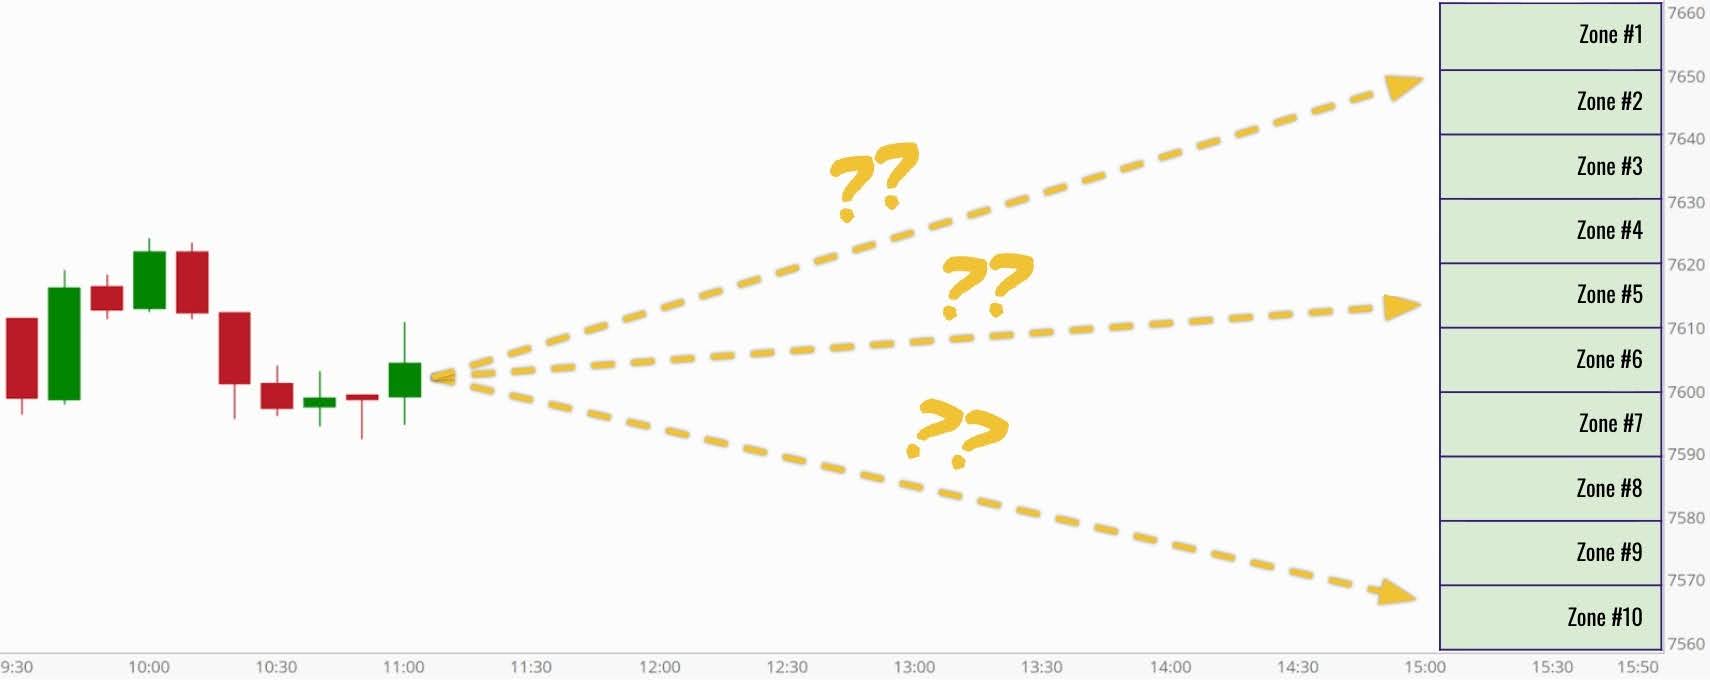
P.S. Don’t Play the Ugly Odds of Trying to Guess Market Direction
Let me show you how high can help flip even the ugliest odds in your favor and target cash regardless of direction.
Disclaimer: We develop tools and strategies to the best of our ability but no one can guarantee the future. There is always a risk of loss when trading. The method has been traded live since July 15th, 2026 – 09/15/26 with a 94.7% win rate on LIVE trades with a 14.4% average return daily – net of winners and losers.