🚨 I’ll be live at 10 a.m. ET with Graham Lindman🚨
We’re covering the 100-day floor bounce, how to trade around the earnings noise, spotting quiet sleeper strength and more [tap to join us for Opening Playbook]
If you’ve been watching the market lately and thinking, “What the heck is going on?” — I get it.
The S&P 500 (SPY) has been whipsawing all over the place. One day we’re up, the next we’re down, and it feels like the market can’t make up its mind.
Look at the daily chart and it’s almost comical how erratic the candles look right now.
But here’s the thing most people are missing. It’s not chaos at all… it’s rotation.
Once you understand what’s happening underneath the surface, the whole picture changes.
The Three Discretionary Sectors Are Running the Show
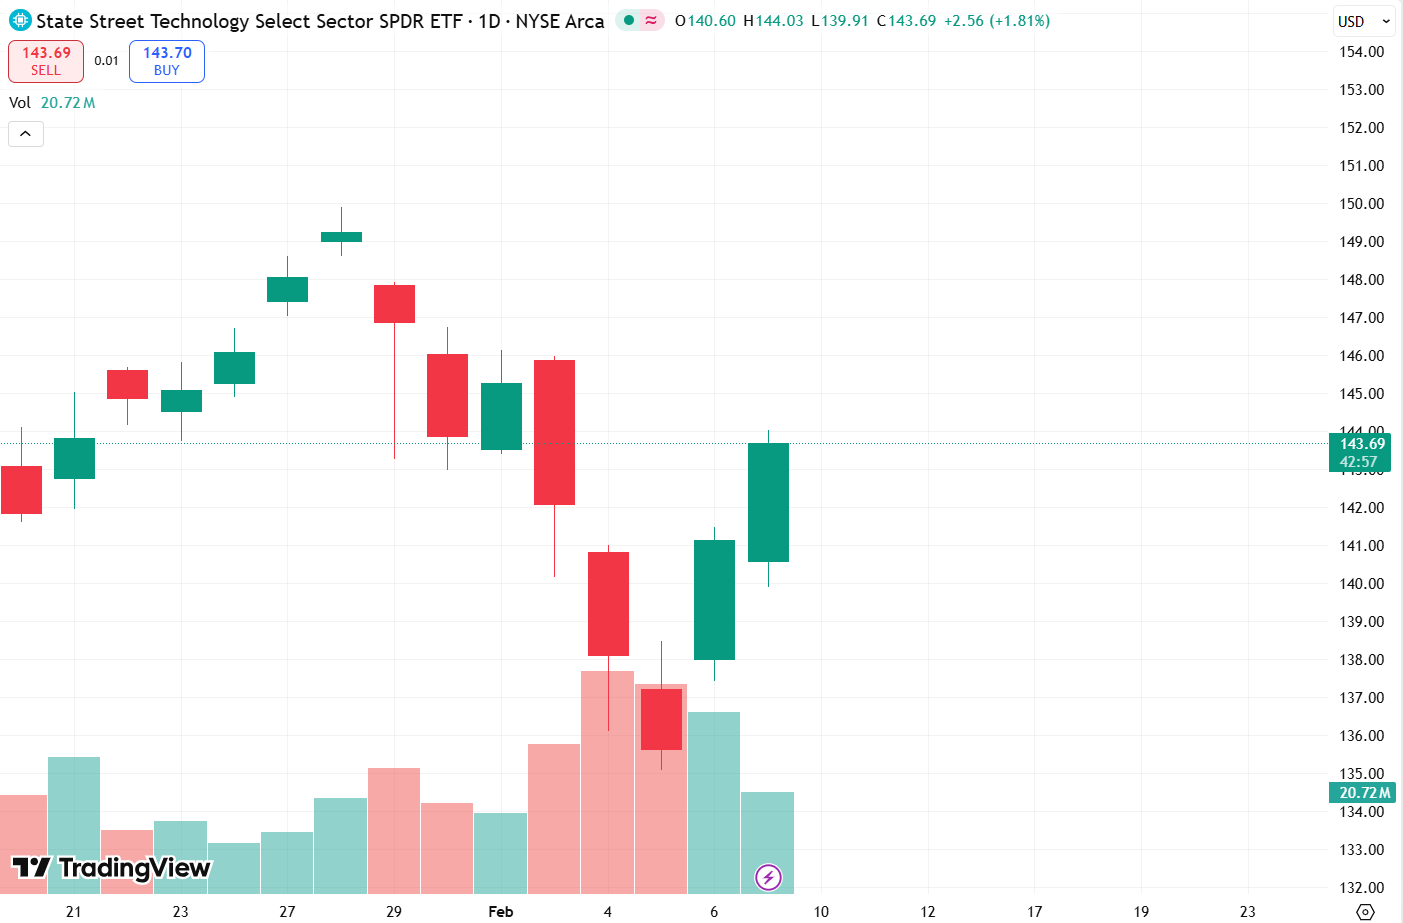
Recently, the Technology sector (XLK) was up more than 1% while everything else was fairly middle-of-the-road. Consumer Discretionary (XLY) and Health Care (XLV) were down, but nothing was flushing more than 1%.
On the surface, it looked like tech was carrying the market. And it was.
But when you zoom out over a seven-day period, the pattern flips. XLK, XLY and XLC — effectively an extension of tech — were down sharply during certain stretches.
At one point, tech was down about 3% over a couple-day span.
Yet the market didn’t completely fall apart.
That’s because less discretionary sectors — especially Energy (XLE) — were strong and consistently green. The S&P 500 Equal Weight ETF (RSP) continued higher even as tech flushed.
That tells you money wasn’t leaving the market. It was rotating.
This type of rotation has played out before. Historically, when leadership sectors stumble but defensive and cyclical groups pick up the slack, the index can move sideways in a way that looks chaotic but is actually very structured.
As the market dips into lower ranges, those defensive pockets around key levels often create opportunities — especially when utilities, staples or energy firm up as discretionary names fade.
Big Names Are Masking the Real Story
Recently, there were fewer green stocks than red stocks even as the market pushed higher.
That seems impossible — until you look at what was doing the heavy lifting.
A small group of large-cap names drove the index higher, including Nvidia (NVDA), Oracle (ORCL), Taiwan Semiconductor (TSM), Microsoft (MSFT), Broadcom (AVGO) and Eli Lilly (LLY).
ORCL alone was up about 9%.
Those moves were large enough to outweigh weakness across a broad list of stocks, pulling the index higher even as most names stayed flat or declined.
This is why visualizing market dynamics matters. When you line up sector performance against index movement — even with a simple rotation view — it becomes clear which groups are supporting the market and which are dragging it.
When tech flushes but defensives hold key lower levels, those dips can turn into strategic opportunities for both short-term trades and longer-term positioning.
The chart may look crazy.
The mechanics underneath it are anything but.
Now don’t forget to join us at 10 a.m. ET weekdays for Opening Playbook, and at 3:30 p.m. ET Closing Playbook!
Nate Tucci
Tucci Trades
You can also follow along and join the conversation for real-time analysis, trade ideas, market insights and more in my official Telegram channel!
Important Note: No one from the New Money Crew team or Tucci Trades will ever contact you directly on Telegram.
*This is for informational and educational purposes only. There is inherent risk in trading, so trade at your own risk.
P.S. Stop Overthinking Your Entries
You probably already know this…
But traders who have been using the Income Machine over the past few months have been going after the market daily…
Without the hassle of overthinking what setup to trade…
Without stressing about portfolio size…
And without being overwhelmed about how long to hold a position before they exit!
If you haven’t already, there’s no cause for alarm.
You can still get FREE access to the Income Machine, as well as 3 juicy income trades available to you right now.
The only thing I need to do is show you exactly how to use this one-of-a-kind engine… and you’re well on your way to a comfortable trading experience.
If you’d like to see what that looks like, you can head over here now.