🚨I’ll be live at 10 a.m. ET with Graham🚨
Powell is officially out as the Fed Chair, and if you want to see how new leadership impacts your portfolio, drop by the Opening Playbook roundtable session today with special guests Lance Ippolito and Chris Pulver [tap to join us for Opening Playbook]
You know what’s hard? Predicting the market.
You know what’s easier? Responding to it.
That’s the whole idea behind a framework I’ve been using lately — and honestly, it’s one of the simplest ways I know to navigate weeks like this when the market isn’t giving you a clear directional signal.
Last week the S&P 500 Index (SPX) was up about 1% at the highs, but by the close it was sitting almost exactly where the week started. On the weekly chart, that leaves you with a pretty neutral pause candle centered around the prior week’s range.
The Nasdaq-100 (QQQ) is showing something very similar — just a broad consolidation structure without much directional conviction.
So what do you do with that?
Most traders immediately start trying to predict the next move. They look for clues, draw trendlines, search for confirmation and try to front-run the breakout. But that process usually creates more hesitation than clarity.
Instead, I just use the candle itself.
The Weekly Candle as Your Trading Boundary
The framework is simple: Draw a perimeter around the weekly candle and let that range dictate your decisions.
If price breaks below the week’s low, you’ve probably got room to the downside and can start evaluating bearish structures. If price breaks above the week’s high, then the market is likely telling you momentum wants to continue higher.
That doesn’t mean you blindly buy the breakout. Context still matters. But the levels themselves remove a lot of unnecessary prediction.
And right now, the broader context is messy.
We’re sitting in a net negative gamma environment, but some of the strongest gamma positioning is still above current price. That’s the kind of setup that can pull markets in opposite directions and create exactly the sort of wide-range chop that frustrates both bulls and bears.
When the structure itself is indecisive, it makes even more sense to let the candle levels define the playbook instead of forcing a directional opinion.
Using Volatility to Frame the Range
This is also where volatility tools become useful.
Average true range (ATR) tells you the magnitude of recent movement. Market maker expected moves help frame the projected range ahead. The CBOE Volatility Index (VIX) and implied volatility give you the forward-looking side of the equation.
Together, those tools help answer an important question: Is this range likely to expand or compress?
That matters because once you’ve defined the boundaries, you can structure trades around the expectation of continuation, breakout or sideways action. In similar environments, some of my better hedges have simply been iron condors placed right in the middle of the range while the market drifted around doing a whole lot of nothing.
Why This Helps During Uncertainty
A big part of this framework is psychological.
After a strong rally, the temptation is always the same: Either chase the next leg higher or aggressively call the top. But a lot of the time, the real pain trade is neither.
It’s the slow sideways stretch where the market spends weeks going nowhere while traders overreact to every small move inside the range. We’ve seen that happen plenty of times after extended runs.
Using the weekly candle as your boundary helps prevent that because it forces discipline. It keeps you from constantly inventing narratives and reacting emotionally to noise.
I’m trying to stay systematic with this myself, and this approach makes that easier.
You’re not predicting. You’re not forcing trades because you think you know what comes next. You’re reacting to clearly defined levels and letting the market reveal its intentions first.
Simple frameworks tend to work best when conditions get noisy.
Now don’t forget to join us at 10 a.m. ET weekdays for Opening Playbook, and at 3:30 p.m. ET Closing Playbook!
Opening Playbook is a bridge for both new and advanced traders to go beyond outdated market narratives into deeper understanding, live at 10 a.m. ET Monday-Friday.
Nate Tucci
Tucci Trades
Follow along and join the conversation for real-time analysis, trade ideas, market insights and more!
- Telegram: https://t.me/nate_tucci
- YouTube: https://www.youtube.com/@NewMoneyCrew
Important Note: No one from the New Money Crew team or Tucci Trades will ever contact you directly on Telegram.
*This is for informational and educational purposes only. There is inherent risk in trading, so trade at your own risk.
P.S. The Gang and I Are About to Kick off the Last-Minute Roundtable
The emergency roundtable is about to kick off!
Like I told you last night…
Friday was Jerome Powell’s last day as Chair of the Fed with Kevin Warsh now set to take over.
Many view him as being closely aligned with President Trump.
The big question now is… what happens next?
Will interest rates stay high?
Will the Fed begin cutting rates?
Or could rates actually rise even further?
And more importantly…
How could Warsh affect the stock market, options trading and volatility moving forward?
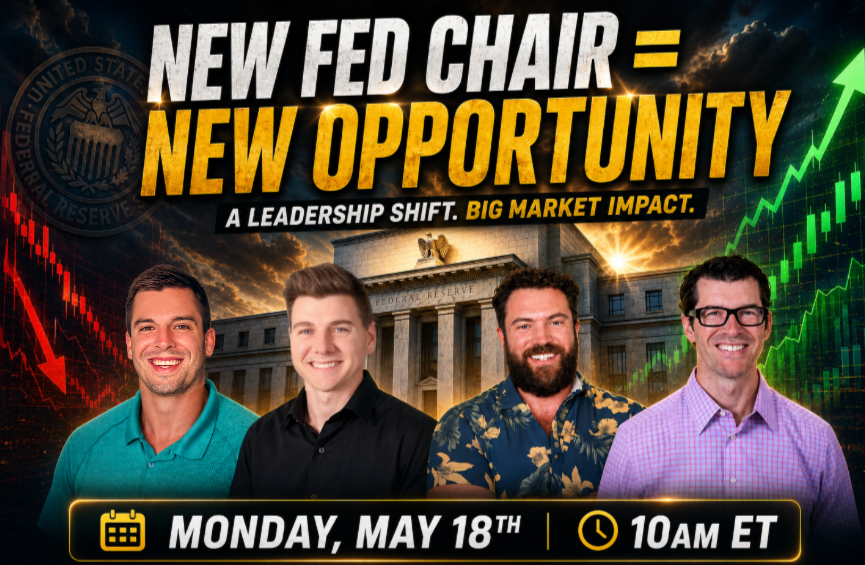
At 10 a.m. ET, there’ll be a last-minute live roundtable discussion as Lance, Chris, Graham, and I break it all down…
And share some actual trade ideas based on what we believe could happen next under the Fed’s new leadership…
I won’t make reckless guarantees when it comes to the stock market…