You can tease a lot of information out of security prices.
Stock options tell you how much volatility the market expects from equity markets over the coming months. You can tease anticipated Federal Reserve interest rate hikes or cuts from Eurodollar futures. And comparing prices across bonds lets you gauge the fear of corporate defaults, mortgage prepayments, and, as I showed you Wednesday, inflation.
That inflation gauge exceeds 3% as of this morning.
At that pace, it takes 24 years to see consumer goods prices double. A high level for sure – the highest so far this century and enough to meaningfully eat into your paycheck. Though not nearly enough to turn dollar bills into kindling.
For that, you need hyper-inflation – a runaway, self-feeding dynamic that can double prices every one to two months… or less.
It’s Mach Speed Money. And to see that coming, you need to keep your eye on the speedometer.
Beating the Money Hammer
Dollars don’t typically sit idly in checking and savings accounts, CDs, and money market funds. Instead, they circulate through the economy.
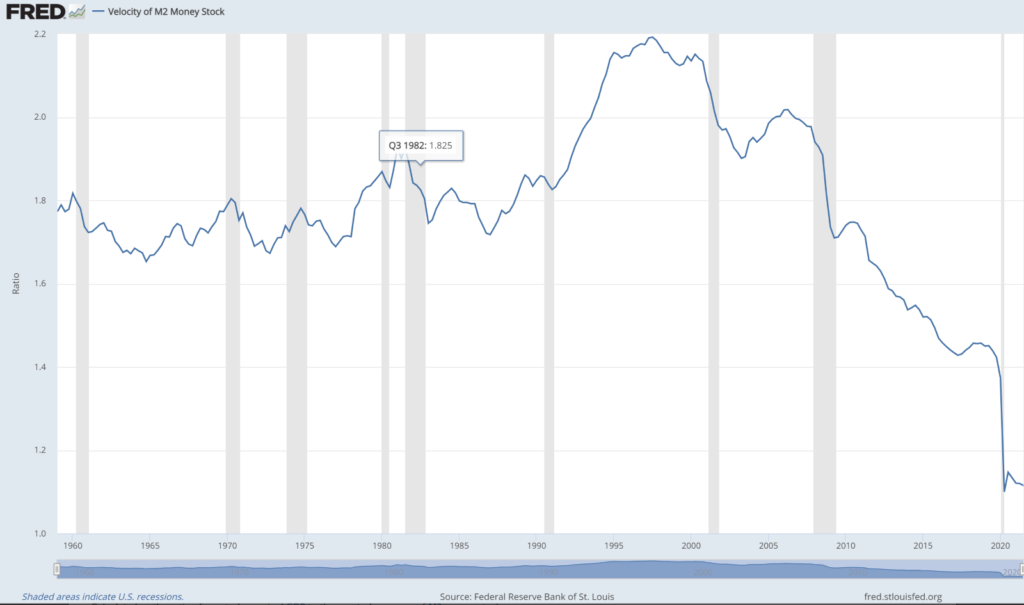
And you can see the number of times that stock of money turns over in the economy (it’s speed) by looking at Money Velocity (shown in the graph below).

Looking all the way back to 1959, you can see that the speed of money peaked in 1997. This was around the time of the Asian Financial Contagion and the Federal Reserve’s first big, orchestrated bail-out.
Since then, money velocity has consistently marched lower, slowing significantly after the internet bubble popped in 2000, even more during the Great Financial Crisis in 2008, and virtually came to a halt with the onset of the COVID-19 pandemic.
As it stands, the current stock of money turns over a little more than once every twelve months.
So, despite supply chain constraints driving up the cost of goods, consumers and businesses sit on whatever money they have more than ever before.
Which hints at what economists call a liquidity trap.
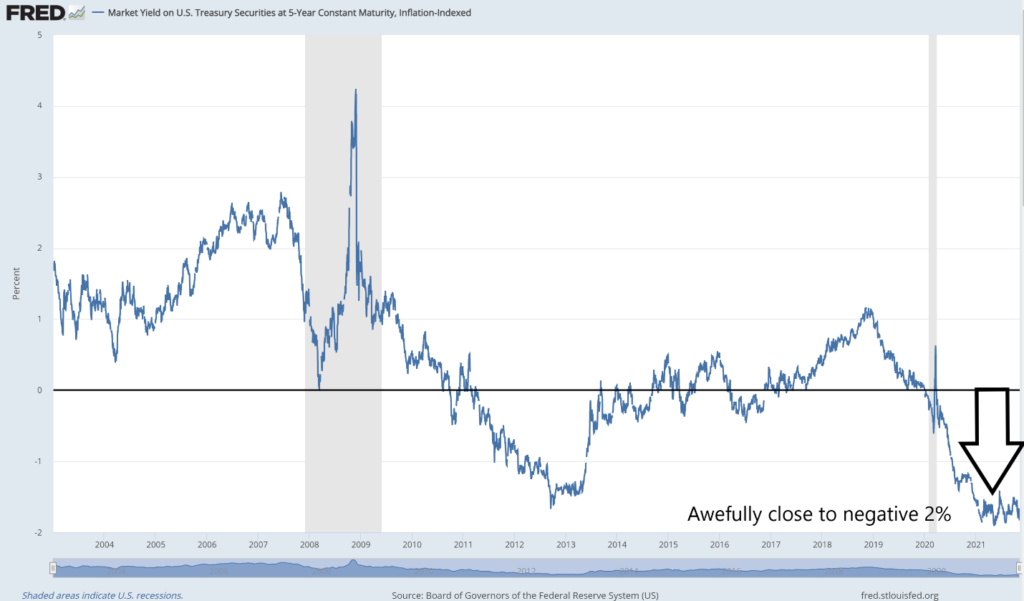
No matter how much money they shove down the economy’s throat through trillions in stimulus, it simply sits there, trapped in the muck of low confidence. Which goes a long way to explaining why TIPS yields signal negative growth like I pointed out to you on Wednesday.

And that potential economic contraction poses the most immediate risk. Policy makers are pushing on a string, trying to spark the animal spirits of consumers, businesses, and investors with free money. Meanwhile, the money piles up, squeezing out more demand than it creates.
But that fact won’t keep them from trying even more artificial stimulus measures. After all, when your only tool is a hammer, every problem looks like a nail. And, to them, the nail of increasingly weak demand requires a big money-printing hammer.
Careful What You Wish For
Ultimately, that hammer will get them the inflation they want. But it’s sheer folly on their part to thing they can micromanage such a complex process.
Because once the fear of rising prices truly takes root in the minds of your average Jane or Joe, the speed of money will surge in a buy-whatever-you-can panic, and they will get inflation… good and hard.
Which is why now is the perfect time to cover your keister from both the immediate risk of collapsing growth and the longer-term risk Mach speed money.
Stimulus spending crowds out real growth, driving down real yields. And since TIPS are bonds, their prices rise as real yields fall. Plus, once inflation “transitions” to higher velocities, you get a double whammy payout in the form coupon and principal payments that rise with inflation.
Now, bitcoin, gold, silver – even the right stocks – these will all pay off under inflation.
But consider buying the iShares TIP ETF (NYSE: TIP) as well.
Because, unlike the Money Mandarins at the Federal Reserve, you have more than one tool in your tool belt.


