Oil markets have been on a tear.
Over the last year, prices have traded from a low of $51 to as high as $87 earlier this week.
The sharp rally has fueled inflation fears as another vital input, natural gas, has rallied right along with it. So too have the prices of nearly everything else, for that matter.
Many point to easy money and trillion-dollar stimulus packages as the cause. No doubt, more money chasing the same goods ultimately pushes prices higher. In fact, this dynamic is the only way to make the phase transition from run-of-the-mill inflation to hyperinflation.
But, for money to be the inflationary cause today, the money printed by the Federal Reserve must first enter the economy and then circulate feverishly. Not sit idly as bank deposits on its balance sheet.
And while the monetary base indeed doubled since the onset of COVID-19 from $3 trillion to over $6 trillion, 65% of that – or $4.2 trillion – has never left the Fed’s coffers. Nor is money circulating any faster since its velocity is as low as it has ever been.
So, we’re not seeing money-fueled inflation, which leaves only supply and demand as the culprit.
And as the economy downshifts to much lower growth, high prices alongside surging supply could set you up for a sweet opportunity to short oil…
Fundamental Weakness
The COVID demand collapse and the near-immediate bounceback caught many drillers on their back foot.
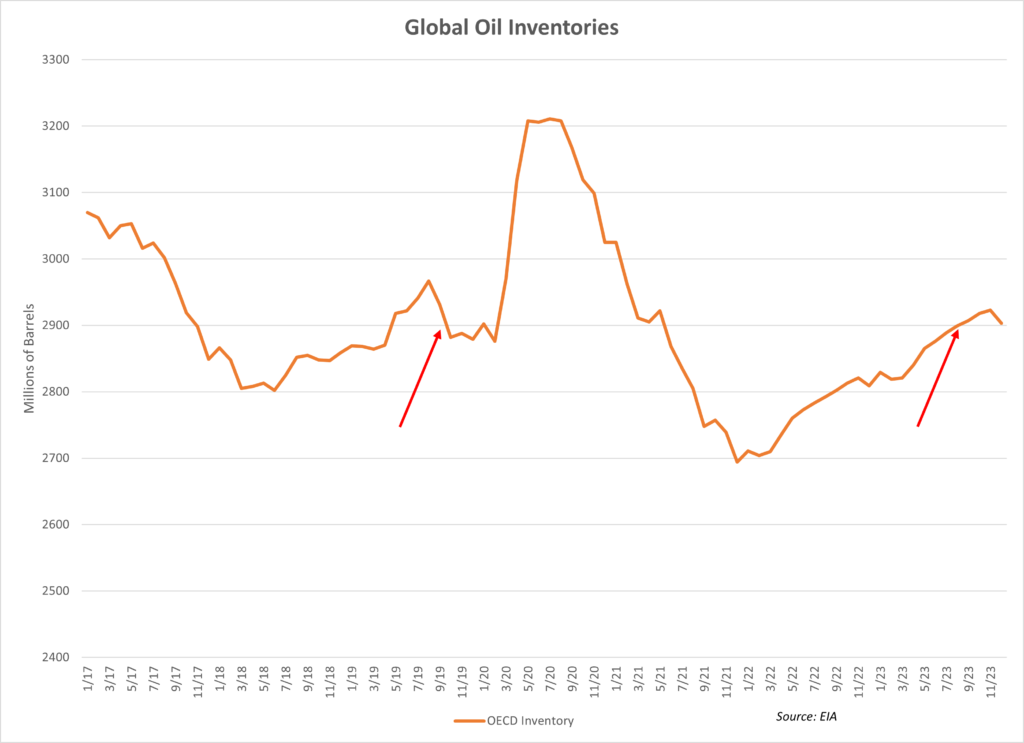
The chart below shows the supply and demand balance going back to 2017.
Oil consumption dropped 20%, and drillers went into triage, shutting down wells and parking rigs. But demand bounced hard off the bottom within a couple of months following lock-downs as we adapted to a world of Zoom calls and Amazon Prime orders.
From June 2020 to October 2021, producers played catchup, with oil prices marching steadily higher as a result.


But since October, the supply and demand picture has normalized. And as you can see in the chart to the right, total inventories have built back up to pre-COVID levels.

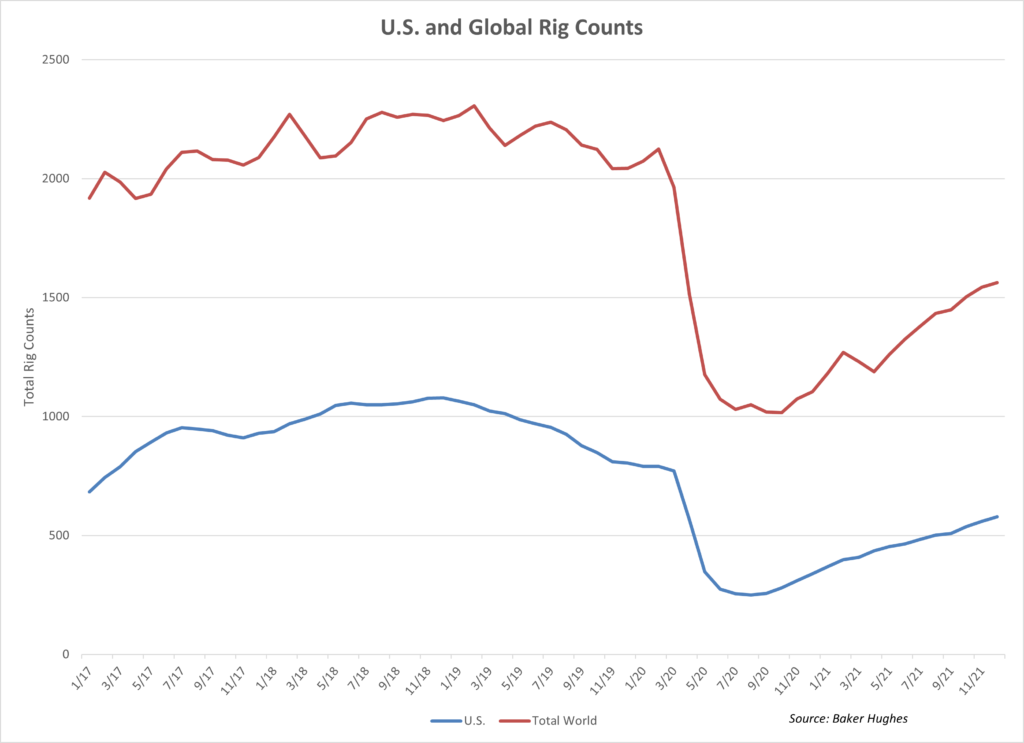
Drillers also show no sign of slowing down. Rig counts, both in the U.S. and globally, continue to rise. Everyone is pumping and drilling. Plus, creditors continue to lend to the sector.
And the continued climb in U.S. Frac Spread Count this year, a leading production indicator, also supports more supply coming online.
To this, you need to consider that economic growth has slowed in the face of a tightening Fed. So we could quickly find ourselves in a situation of rising supply and stalling demand.
Fundamentally, oil prices have gotten over their skis. And the technicals, from my perspective, also point lower.
Reverting to (or Through) the Mean
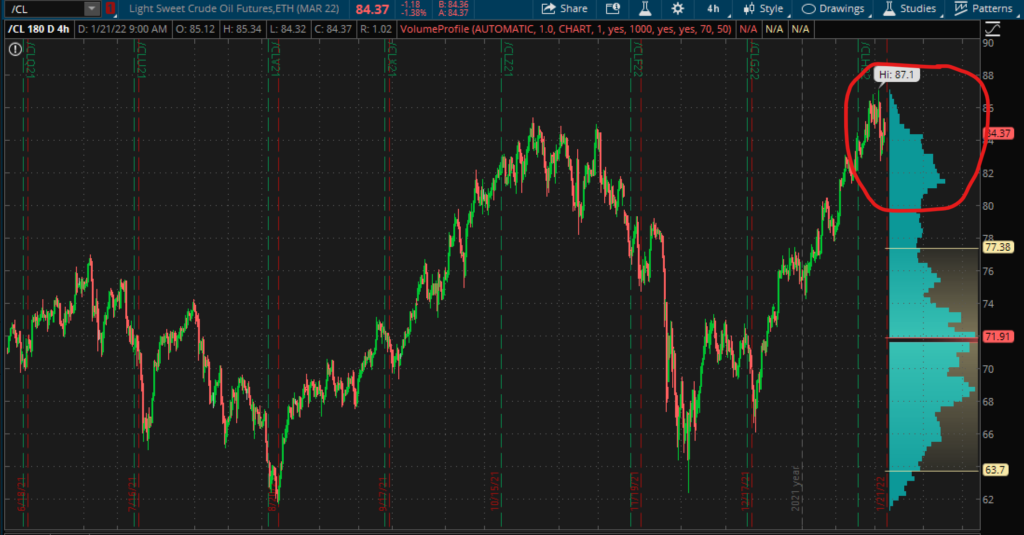
The chart below plots the price of oil over the last six months. To light blue histogram to the right shows the trading volume broken down by price.

During that time, the volume-weighted average price traded at around $72 per barrel, with volume tapering off significantly below $66 and above $84. The price currently sits well above its high-volume range and looks poised to head back towards the $72 range (and likely below).
Look at almost any other time frame, and the setup looks the same – declining volume on rallies and volume-weighted average prices in the 70s.
For those of you looking to take advantage of opportunities like this, you’re free to join my group over in Telegram.
Currently, we’re focusing on playing my anticipated sell-off in oil. Over the last month, we traded both the long and short side of the S&P 500 plus traded the British Pound/U.S. Dollar exchange rate.
I also routinely do fundamental Deep Dives on stocks plus other live video chats where we look into some aspect of the market or talk through trade rationale.
So, join the Prosperity Pub Telegram channel and its growing community of traders, investors, and folks that simply want to be informed and gain an edge.
Because you don’t want bad ideas to push you into following the crowd.


