If you’ve ever heard someone say seasonality doesn’t matter anymore, they’re not looking at the right data.
I just pulled up 75 years of S&P 500 performance, and the patterns are still there — clear as day. June tends to be a choppy transition month, July often brings strength, and late summer into early fall?
That’s when the real shake-ups usually hit.
But here’s where it gets interesting…
It’s not just about the broad market. The real edge is in the sectors.
Tech (XLK) names tend to lead in May and July. Materials (XHB) and Industrials (XLI)? They often underperform in early summer but pick up into August. And Energy (XLE) has its own quirks — weak in late Q2, stronger into hurricane season.
These aren’t just random patterns — they’ve played out year after year, even across different economic backdrops.
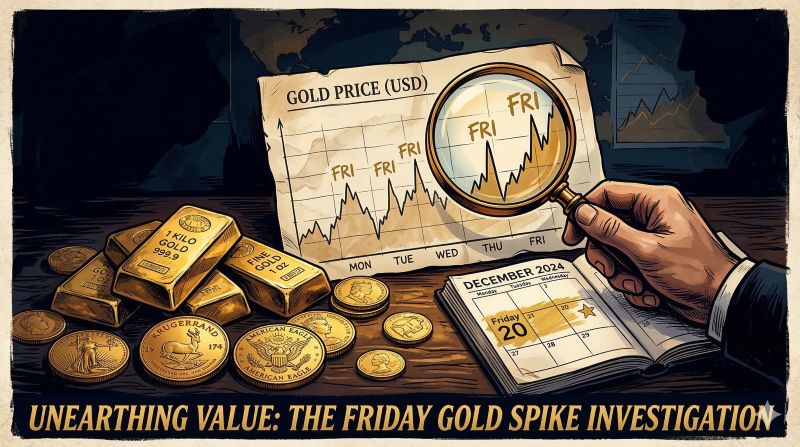
And then there’s gold…
Gold has a fascinating seasonal curve. It usually sees a soft patch in June — often a low-volume drift lower — and then finds strength again heading into August and September. That pattern has repeated enough times that I actually mark it on my calendar.
It’s not about treating these as guarantees. There’s no magic calendar that predicts the market. But there are consistent tendencies shaped by decades of fund flows, earnings cycles, and even psychology.
If you’re just trading off headlines and setups, you’re only seeing half the picture. But when you layer seasonality on top — especially at the sector and commodity level — you start seeing patterns that most traders completely miss.
I’m not saying to buy gold just because it’s June or to load up on tech just because it’s July. But when a seasonal trend lines up with a solid chart and the right option pricing?
That’s when I lean in.
Because the goal isn’t to predict every move — it’s to stack small edges. And seasonality is one of the cleanest edges I know.
Use it.
Apex Indicator: AMD
Well, the market has taken a little breather. But tech is making a comeback, and one stock looks like it might get a signal soon.
First, here’s our model portfolio for these free signals I share each week:

That 100% win rate won’t last forever, of course, but it’s great to see early success! There are no guarantees in trading, so trade at your own risk. But we’ll keep these signals coming because I want to show off the power of my Apex Indicator.
So, what stock is close to an entry?
Advanced Micro Devices (AMD). Here’s the chart:

It’s been making a nice bullish move lately, but it’s currently going sideways. If we get another round of good tariff or economic news, AMD could generate another buy signal soon. Our target will be up around the $124 level. Our stop would be down at the $103 level.
Remember, we enter these trades using wrap orders, and for more training on how to place wraps… go here!
That’s all for today. I hope everyone has a great weekend — join me and Nate at 10 a.m. ET weekdays for “Opening Playbook”!
Graham Lindman
Graham Lindman Trading
Follow along and join the conversation for real-time analysis, trade ideas, market insights and more!
Important Note: No one from the ProsperityPub team or Graham Lindman Trading will ever contact you directly on Telegram.
*This is for informational and educational purposes only. There is inherent risk in trading, so trade at your own risk.
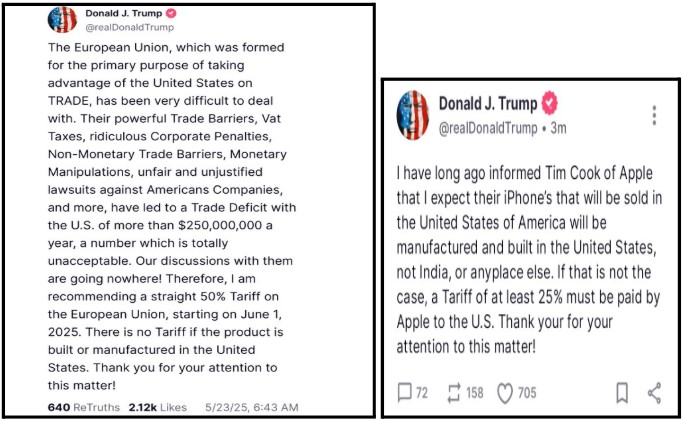
P.S. New Trump Tariffs Could Send Market Spinning Yet Again
It’s been a whirlwind in the markets this year.
Following President Trump’s latest push for steep new tariffs…
Including a proposed 25% on Apple products and up to 50% on the EU…
Market sentiment is starting to shift fast.
If you haven’t seen the news yet, it’s catching fire across social media:
But despite all the chaos, something else seems to be getting all the attention at our company right now.
And as you’ll soon see, it has to do with a “secret” trade that seems to have the power to crush it with nearly 100% accuracy…
Just by simply taking advantage of specific weekend options every week!
While we cannot promise future returns or against losses…
Disclaimer: The profits and performance shown are not typical. We make no future earnings claims, and you may lose money. The trades expressed are from historical back tested data unless otherwise stated in order to demonstrate the potential of the system. The average backtested return per trade (winners and losers included) is 20.6% per trade over the weekend and a 94.3% win rate with an average winner of 26.9%.