>>>I’ll be live with Jack Carter at 11:30 AM ET for Market Masters — we’ll cover current trends and trades, actionable opportunities, trading education and more… CLICK HERE!<<<
I spend a lot of time running statistical analysis on trade setups — it’s part of what keeps me sharp and helps me separate the noise from the real opportunities. Most days, I’ll scan through dozens of potential plays and honestly, most of them are just average. Maybe a 75% win rate and a 1.1 profit factor, nothing special.
But every once in a while, I come across something that makes me sit up straight in my chair. Friday was one of those days.
I was reviewing a couple of setups that looked decent enough, but then I pulled up Walmart (WMT) and the numbers stopped me cold. This setup shows a 67% win rate with a 5.6 profit factor across 68 historical trades — already solid performance that would make most traders happy. But when I filtered for modern market conditions, the statistics jumped to a 91% win rate with a 9.1 profit factor. Those are the kind of numbers that don’t come around often.
The Edge Is Rare — and Timing Matters
Part of what makes this setup so compelling is how infrequently it appears. A pattern like this fires off roughly once per year on average. That rarity strengthens its statistical power, but it also creates a trade-off in timing. You can’t force a yearly setup to behave like a weekly momentum play.
The broader market only reinforces that point. Volatility has been whipping around — pulling back one moment then ripping higher the next — which keeps traders on edge and makes quick-hit strategies harder to execute cleanly. If you’re thinking about jumping into short-term options expecting an immediate reaction, you’re probably setting yourself up for frustration. This setup doesn’t care what happens this week. It tends to work, but it works on its own timeline.
Economic conditions add another layer. With unemployment running hotter than expected, the market is starting to bake in the possibility of a rate cut in December. That kind of macro backdrop affects sentiment, volatility and the pace at which trade setups unfold. None of it ruins the Walmart play, but it reminds you that patience is part of the edge.
Managing Risk While Letting the Trade Work
The entry on this setup is $111 and it’s triggering now. But as good as the stats look, it’s still trading — not certainty. All trading involves a substantial risk of loss, and if you put money into the market, you have to accept the possibility that you might lose it. That’s why having a clear plan matters just as much as having a strong setup.
This particular pattern can take up to seven months to fully play out. That means the wrong timeframe can turn a high-probability trade into a losing one simply because you ran out of runway. Longer-dated options or shares tend to be a better fit when you’re dealing with a setup that historically rewards patience.
With 68 trades in the historical data there’s enough sample size to trust the pattern, and the modern performance only strengthens the case. The numbers are unusually strong for a stock as steady and liquid as WMT, which is why I’m watching it closely and may take the trade myself. If you’re looking for a statistically backed opportunity and you’re willing to let the setup develop, this one deserves your attention.
Jeffry Turnmire
Jeffry Turnmire Trading
I host my “Morning Monster” livestream at 9:15 a.m. ET each weekday on YouTube, and then “30 Minutes of Awesome” at 5 p.m. ET each Tuesday!
Please check out my channel and hit that Subscribe button!
You can also follow along and join the conversation for real-time analysis, trade ideas, market insights and more!
- Telegram:https://t.me/+6TdDE7-F6GlhMmJh
Important Note: No one from the ProsperityPub team or Jeffry Turnmire Trading will ever message you directly on Telegram.
I’m just a regular dude in Knoxville, Tennessee: a husband, father, civil engineer, urban farmer, maker and trader.
I’ve been at this trading thing with real money for 20-plus years, and started paper trading over 35 years ago. I have a knack for making some epic predictions that just may very well come true. Why share them? Because I like helping other people — it’s the Eagle Scout in me.
*This is for informational and educational purposes only. There is inherent risk in trading, so trade at your own risk.
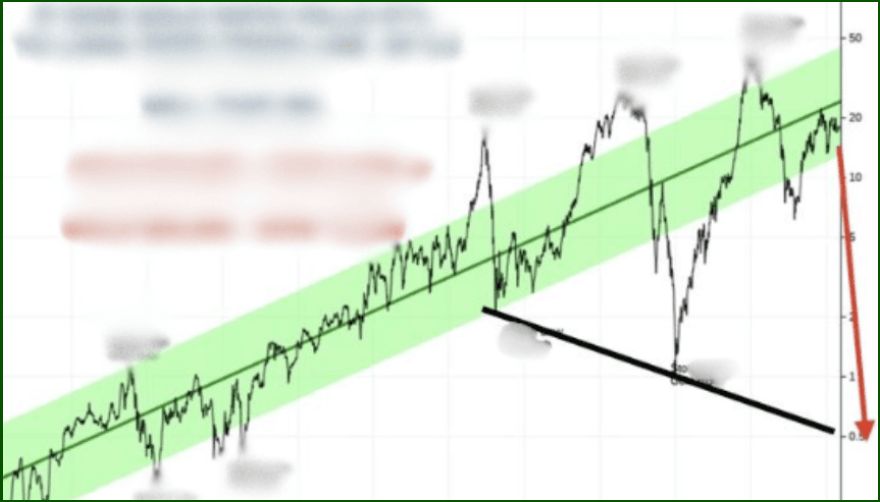
P.S. WARNING: The Data Unfolding Right Now Is Disturbing!
I’m raising a major red flag on the economy – and this isn’t hyperbole.
The data flashing across my screen looks disturbingly similar to the early warning signals we saw in 2020…
And if those patterns are repeating, we may be on the front edge of something far more serious than a recession.
Call it what you want – a severe downturn, a systemic break, even the early stages of a modern depression – but the warning signs are stacking up fast.
Now, this isn’t a “doom headline” with no direction.
Because every major crisis in the past century has delivered one thing consistently:
A massive, generational opportunity in Gold.
Back in 2020, when these same signals started to flash, I used this exact roadmap to turn a $250k account into $1.4 million.
And if this setup plays out again, Gold’s path to $10,000 is mathematically reasonable.
No guarantees on the market, of course – there never are.
But if the market cracks the way I believe it might, sitting on the sidelines won’t protect you… and it certainly won’t help you profit from the shift.
That’s why I’ve laid out the full game plan… how to position defensively and how to capitalize if the coming move accelerates.
If You Want the Roadmap, It’s Right Here
We develop tools and strategies to the best of our ability, but no one can guarantee the future. There is always a risk of loss when trading past performance is not indicative of future results. All examples shown today are based on a $2,000 starting stake unless otherwise stated. 11/22/2023 – 11/12/2025 on live trades the win rate has been 70.4% with an average return of 19% (winners and losers) with an average hold time of 3 days.