🚨I’ll be live at 11:30 a.m. ET with Jack🚨
We’ll share the report with today’s top Income Harvester trades, break down our personal setups, discuss what’s moving markets and more [tap to join us for Market Masters]!
There’s a setup developing in Robinhood (HOOD) that’s worth watching — especially if you understand how technical resistance works and what happens when beaten-down names start climbing back.
And if you’re a regular reader here, none of this should surprise you! Here’s a piece I did on Feb. 18: The ‘Absolutely Beautiful’ Pattern That Just Flashed a Buy Signal in HOOD
Well, that beautiful pattern is playing out nicely… and there’s still plenty more room to run.
Now, the stock looks like it wants to move, but it has to work through a tight cluster of resistance first. We’re not dealing with a single ceiling. We’re looking at the Market Roadmap line…
And then a prior high from about two weeks ago, and the key 61.8% Fibonacci retracement sitting near $110.
When multiple resistance levels begin stacking like this, breaking through them often sets the stage for a larger push toward the next major zone.
It’s the kind of pattern that shows up across many charts — when price starts pushing through the 61.8%, it’s often preparing to rally on toward the bigger resistance above.
What makes the setup compelling is that if HOOD can clear all these levels, a move toward $300 — about 3.75x from today’s price — becomes reasonable.
That target comes straight from matching the magnitude of last year’s rally off the lows — a method that consistently applies across many tickers. The idea is simple: When a stock demonstrates it can make a certain type of move once, it can often repeat that move under similar conditions.
The Resistance Roadmap
First, I’m watching for a move back toward $90 as a test of whether buyers are serious. The broader structure shows a series of lower highs before the breakdown, creating natural resistance as the stock retraces upward.
Traders caught in those prior highs tend to sell into rallies to get out at break-even, which reinforces each resistance level.
But if HOOD pushes through the Roadmap line and takes out the recent prior high, the 61.8% at $110 becomes the real pivot. When a stock claws its way through clustered resistance like this, trapped longs are forced to cover and shorts begin feeling pressure.
That combination can create sharp short-squeeze-style bursts — the kind of snap moves you see when price finally breaks cleanly through congestion that’s been building for weeks.
The Market Cap Reality Check
All of this becomes even more interesting when you consider HOOD’s size. Its market cap is tiny compared to true mega caps. A small burst of buying can move the price quickly because its entire valuation is dwarfed by single-dollar moves in giants like Google (GOOGL) or Nvidia (NVDA).
Three dollars in NVDA represents more market cap than HOOD as a whole, which shows how little force it takes to get HOOD moving once resistance gives way.
That said, small caps work both ways. The same dynamics that fuel big upside can reverse sharply if momentum stalls. Patterns fail, breakouts fade and retracements in names this small can be brutal. It’s worth keeping that risk in mind.
If HOOD can put in the work and clear its ceilings, the path toward $300 opens up based on prior rally magnitude. But as always, the stock has to earn it.
Jeffry Turnmire
Jeffry Turnmire Trading
I host my Morning Monster livestream at 9:15 a.m. ET each weekday on YouTube, and then 30 Minutes of Awesome at 5 p.m. ET each Tuesday!
Please check out my channel and hit that Subscribe button!
You can also follow along and join the conversation for real-time analysis, trade ideas, market insights and more!
- Telegram:https://t.me/+6TdDE7-F6GlhMmJh
Important Note: No one from the ProsperityPub team or Jeffry Turnmire Trading will ever message you directly on Telegram.
I’m just a regular dude in Knoxville, Tennessee: a husband, father, civil engineer, urban farmer, maker and trader.
I’ve been at this trading thing with real money for 20-plus years, and started paper trading over 35 years ago. I have a knack for making some epic predictions that just may very well come true. Why share them? Because I like helping other people — it’s the Eagle Scout in me.
*This is for informational and educational purposes only. There is inherent risk in trading, so trade at your own risk.
P.S. CashBot Is Prepping the Next 3 1DTE Trade Setups!
I want to hand you the top-to-bottom rundown…
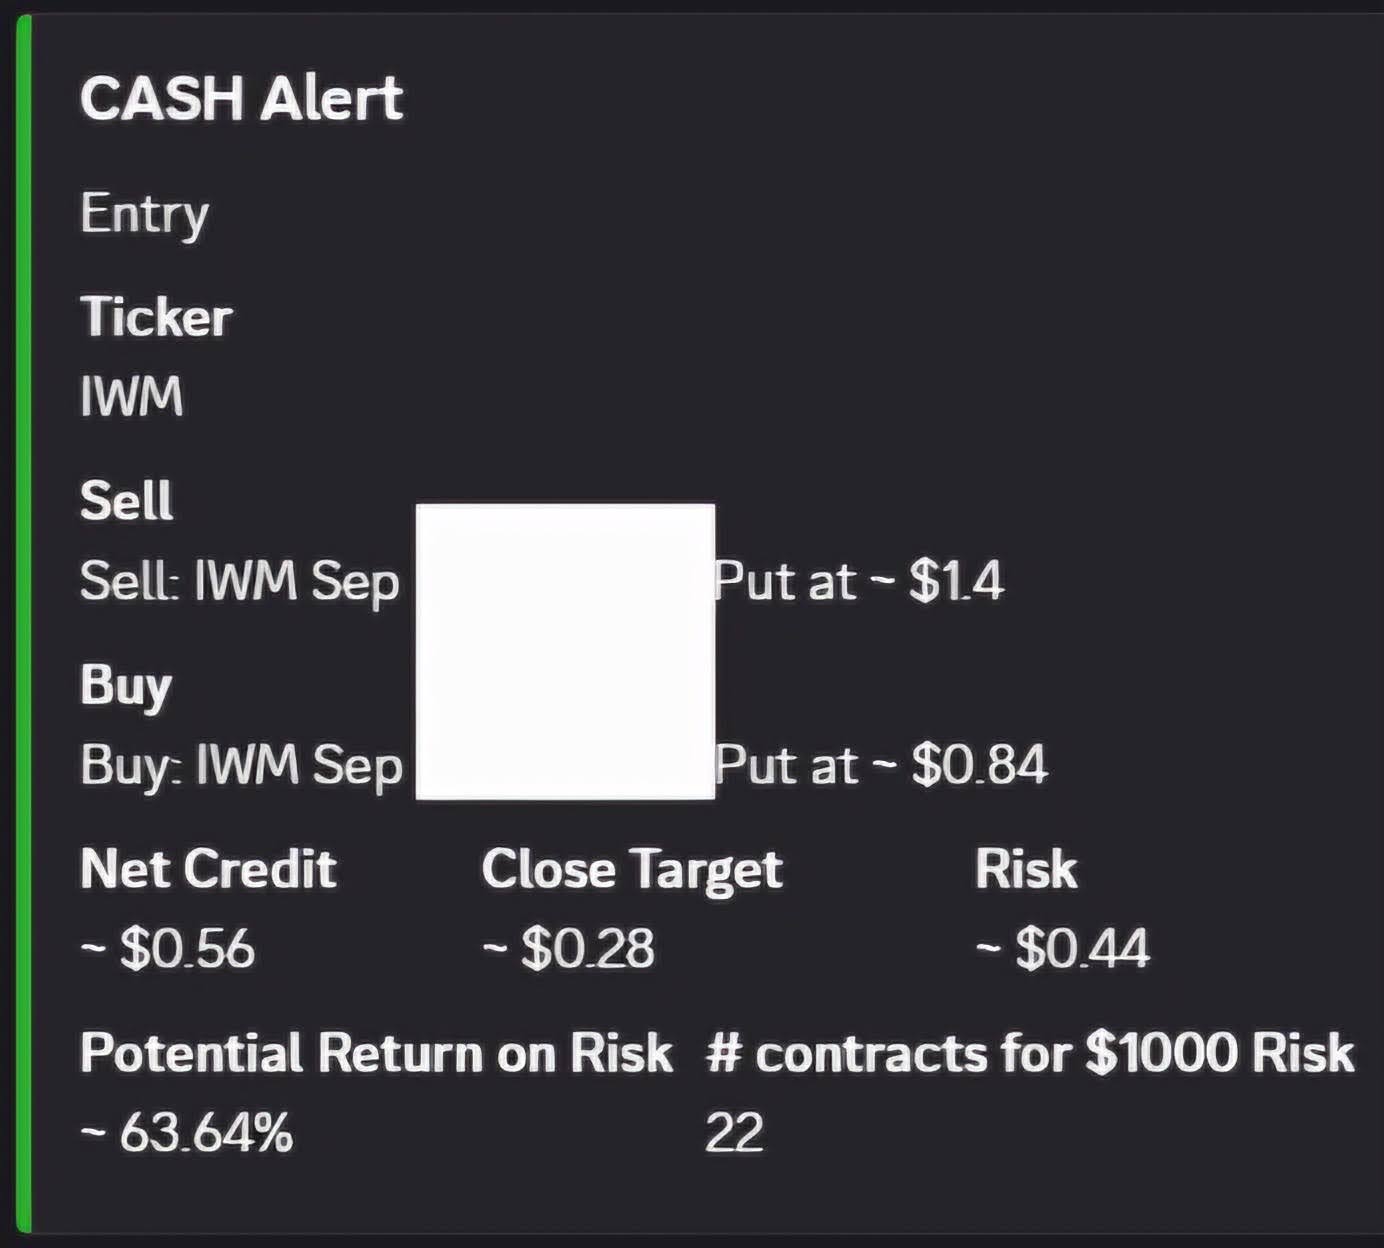
Of how CashBot was able to fire off high-frequency income trades like this…