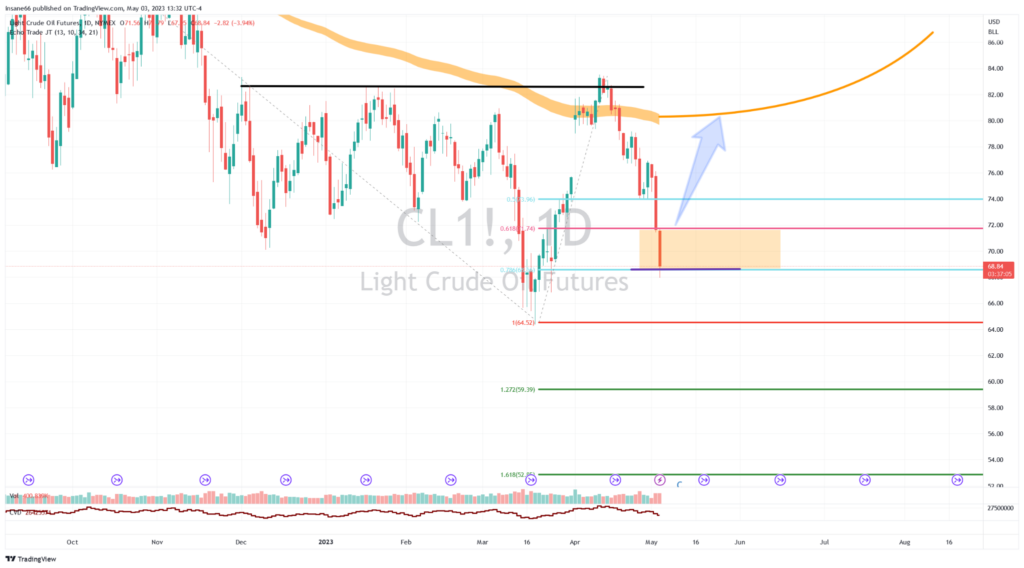
This weeks chart of the week is on Light Crude Oil Futures (Ticker: CL1! on TradingView)
I highlighted the area between the 61.8% and 78.6% Fibonacci retrace levels. This is a potential reversal zone.
Oil getting a daily close above 72 is the first indication that we might see a rally back up to my roadmap line up around 80.
However this area is fraught with danger, because a daily close below that 78.6% level around $68 can lead to a continuation and extension lower for oil down to a target around $59.
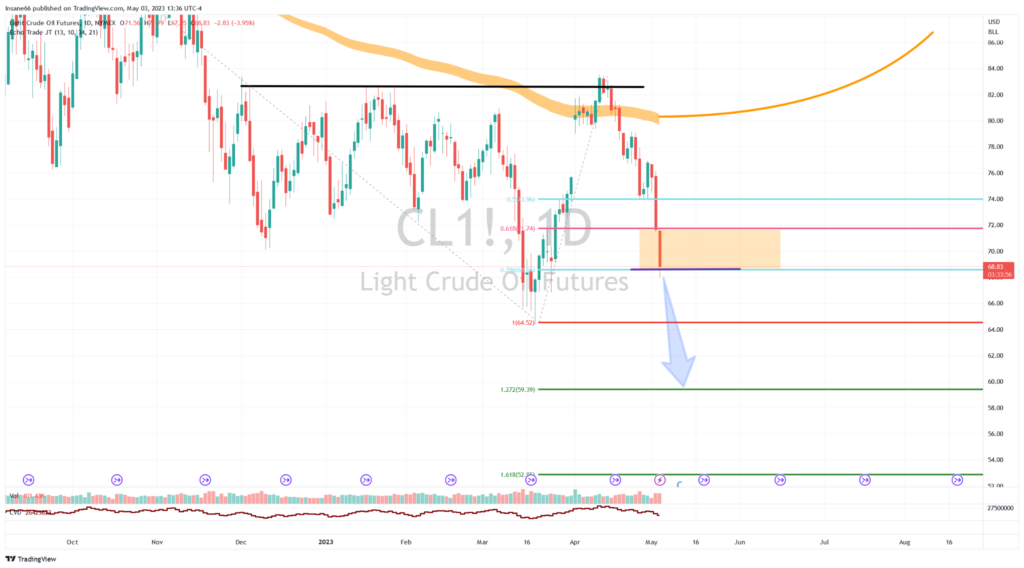
I know none of this fits with the narrative being pushed in the mainstream media, but that is why I use technical analysis.
If you are interested in having the Roadmap line on your chart and how to use it, we have a $5 special running right now.
Have a great week!
Jeffry