🚨 I’ll be live at 10 a.m. ET with Nate Tucci🚨
We’ll have a couple of guests on ready to talk explosive tickers like IREN, WULF, NBIS and more [tap to join us for Opening Playbook]!
I know it’s been a frustrating few months. We’ve been trading in a tight, choppy range since October, and honestly, it’s been painful — we’ve been grinding nowhere fast for four months. But the very compression that’s driving traders crazy might be setting up one of the most reliable bullish patterns I track.
The Nasdaq Bollinger Band width is at the lowest level since 2016. If you’re familiar with Bollinger Bands, you know they expand when volatility picks up and contract when things get tight.
When I say volatility, I’m talking about the candle movement each day — and right now, that movement has compressed to levels we haven’t seen in eight years.
A Perfect Historical Track Record
Here’s where it gets interesting. This setup has shown up five times since 1995, and in every one of those cases, the Nasdaq pushed higher over the next month and broke out to the upside. That’s a flawless record across nearly three decades.
These weren’t calm periods either. We’re talking different market environments, different catalysts and different macro backdrops — yet the pattern was reliably followed by a bullish expansion.
When you see volatility compress this hard and this consistently, the market is likely coiling for a move. The historical reliability here isn’t something to dismiss lightly, especially when we’re staring at the sixth occurrence of this pattern right now.
The Setup That’s Building Right Now
The very thing frustrating swing traders — the lack of directional movement — is exactly what creates the spring-loaded setup. We’re getting compression across major tech names, and from my perspective, we just need some good news, or maybe we just don’t need bad news from Nvidia (NVDA) earnings today after the close, and we can break higher.
There’s another piece adding fuel to the bullish case: Energy stocks are showing astonishing market breadth. Every major energy name is currently above its 50-day moving average — 100%.
That kind of unanimous strength in a heavyweight sector doesn’t happen often, and when it does, it tends to support broader market momentum. When a defensive and economically sensitive sector moves in lockstep like that, it usually means underlying demand is healthier than the choppy index action suggests.
On top of that, we’re sitting right at the time of year when markets often pivot. End-of-February seasonality has a habit of flipping the switch. Historically, this is the point in the calendar when indices shake off winter consolidation and start climbing into spring.
It’s not a guarantee, but it lines up almost perfectly with the compression pattern we’re seeing now.
This consolidation period has been building energy, and when Bollinger Bands contract this dramatically, they’re typically followed by expansion and meaningful directional movement. The question isn’t whether a big move is coming — it’s whether you’ll be positioned when it happens.
I’m presenting this as both a bull and bear case so you can make your own decisions with the data. But the historical precedent, the sector strength and the seasonal timing all argue that this compression pattern deserves serious attention.
Graham Lindman
Graham Lindman Trading
Follow along and join the conversation for real-time analysis, trade ideas, market insights and more!
- Telegram:https://t.me/+abM5RWRJKrpkNWI5
- YouTube:https://www.youtube.com/@NewMoneyCrew
Important Note: No one from the ProsperityPub team or Graham Lindman Trading will ever contact you directly on Telegram.
*This is for informational and educational purposes only. There is inherent risk in trading, so trade at your own risk.
P.S. You Want More Than Just the Lotto Board on Saturday?
A while back, I ran a poll in my Telegram channel about the Lotto Board…
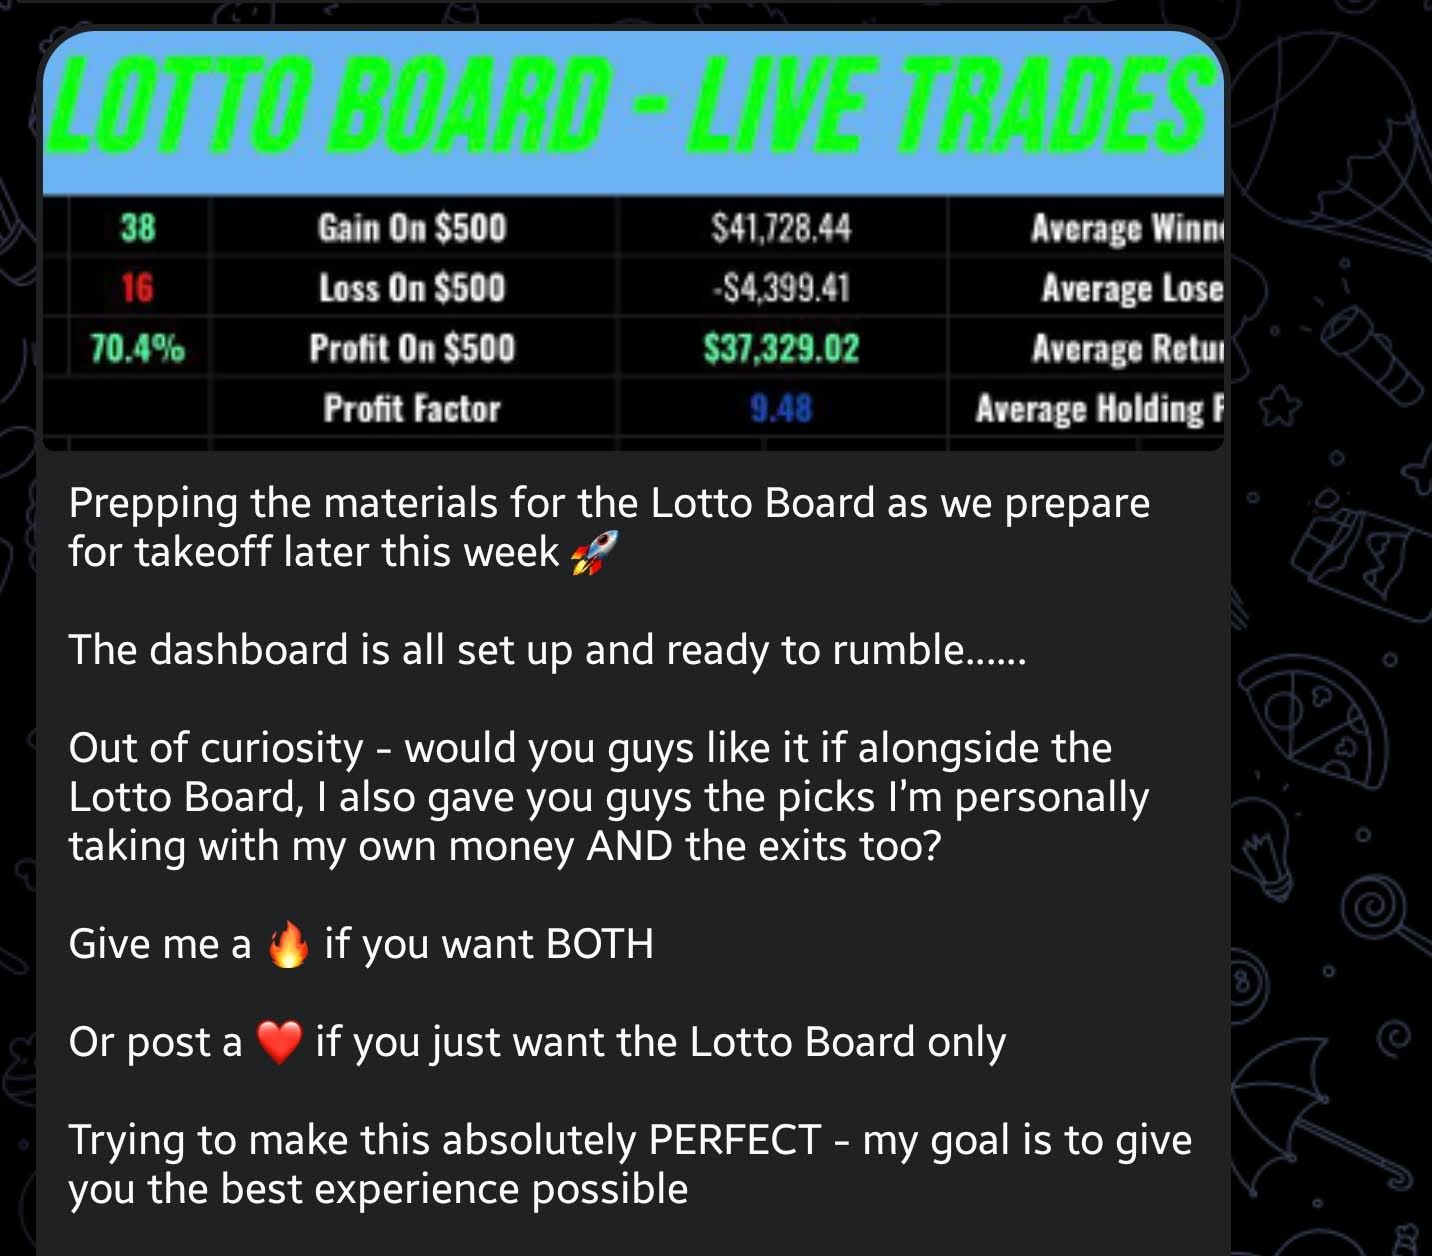
The response was clear: You want more than just access.
Which tells me when I open the doors at 11 a.m. ET on Saturday, you’ll have your hands quite full.
I’ll share the full details very soon, but for now, make sure you don’t miss the Lotto Board Red Carpet Event this Saturday.
Here’s what’s on the agenda.
I’ll give you a complete inside look at how the Lotto Board isolates 2x, 3x and even 4x or more opportunities on a daily basis.
You’ll see the intentional mispricing that creates those setups in the first place… the actual math behind why these opportunities show up…
And then I’ll show you where to get full access to the Lotto Board.
I can’t make absolute trading guarantees…
But at the end of the Red Carpet Event…
You’ll have the opportunity to start using the Board for your own trades as early as next Monday.
All you have to do is register to save your seat…
We develop tools and strategies to the best of our ability but no one can guarantee the future. There is always a risk of loss when trading. Past Performance is not indicative of future results. Between 1/8/26 through 2/17/26 the “Lotto Board” trades taken with real money by Graham Lindman have produced a 79.5% win rate, with an average return of 170% and an average winner of 230% over a 9 day hold time on average – and a 19.93 Profit Factor.