🚨 I’ll be live at with Alex at 2:30 p.m. ET🚨
We’ll cover whether to buy the dip with bonds up and markets down, the specific flows we’re seeing ahead of NVDA earnings this week, my take on the latest oil volatility and more [tap to join us for Profit Panel]
You’ve probably heard the argument by now: We’re heading straight back into a 1970s-style stagflation environment.
The basic thesis usually sounds something like this: Buy commodities, avoid stocks, expect inflation to spiral and prepare for years of economic stagnation.
And to be fair, there are a few similarities on the surface.
But once you dig deeper into how the economy actually functions today, the comparison starts falling apart pretty quickly.
The structure of the economy in the 1970s was completely different from the structure we have now. If you’re building an investment framework entirely around historical analogies without accounting for those changes, you’re probably oversimplifying things.
There’s also another reality people tend to ignore.
An enormous amount of money is tied to markets continuing to appreciate over time — retirement accounts, pensions, institutional investment models and corporate capital structures all depend on long-term market growth.
That doesn’t mean markets can’t decline. Of course they can.
But it does mean the financial system itself is heavily incentivized toward long-term expansion rather than permanent economic collapse.
The Economy Isn’t Built the Same Way Anymore
Back in the 1970s, manufacturing represented roughly 25% of gross domestic product. A huge portion of the economy depended on factories, industrial production and blue-collar labor.
Today, manufacturing accounts for closer to 11% of GDP.
That’s not a small adjustment. That’s a completely different economic structure.
The labor market has also changed dramatically.
In the 1970s, many union contracts included cost-of-living adjustments tied directly to inflation. As prices rose, wages automatically increased alongside them. That helped create the wage-price spiral that kept inflation feeding itself for years.
That dynamic is much weaker today.
Inflation can still rise, obviously, but wages no longer automatically reset upward across huge portions of the workforce the way they once did. That alone changes how inflation behaves over longer periods.
What Drives the Economy Now
Today’s economy is much more dependent on technology, services, capital flows and innovation-driven sectors.
Artificial intelligence, cloud infrastructure, semiconductors and energy innovation are playing a much larger role in growth than heavy manufacturing.
It’s just not the same environment.
And yet every few months, another wave of headlines appears claiming the market is about to collapse exactly the way it supposedly did decades ago.
Fear narratives tend to recycle because they attract attention.
But investors still need to separate emotional storytelling from actual market structure.
Why Historical Analogies Can Become Dangerous
The biggest risk with these comparisons is that people start positioning portfolios for a world that may not actually exist.
That doesn’t mean you ignore inflation risks or macroeconomic problems. It just means you stay careful about assuming history repeats in perfectly clean cycles.
Markets evolve. Economies evolve. Incentive systems evolve.
If your entire framework is built around replaying the 1970s trade-for-trade, you may end up fighting the current market instead of understanding it.
And honestly, that’s where a lot of investors get themselves into trouble.
Scary narratives are easy to sell because fear always gets attention. But making major portfolio decisions based entirely on worst-case analogies usually creates more emotional trading than disciplined investing.
It’s better to focus on the market that’s actually in front of you instead of trying to force today’s economy into a historical template that no longer fully fits.
👉 Click here to join Profit Panel at 2:30 p.m. ET on weekdays!
Profit Panel equips traders to adapt to any market condition, by knowing when to trade aggressively and when to stand aside, live at 2:30 p.m. ET Monday-Friday.
Geof Smith
Geof Smith Trading
Follow along and join the conversation for real-time analysis, trade ideas, market insights and more!
- Telegram: https://t.me/+lm8_Nq3Su104NmFh
- YouTube: https://www.youtube.com/@FinancialWars
Important Note: No one from the ProsperityPub team or Geof Smith Trading will ever contact you directly on Telegram.
*This is for informational and educational purposes only. There is inherent risk in trading, so trade at your own risk.
P.S. 14 Weekly Payouts in 2026 Alone!
Every Tuesday, I trade the exact same ticker with the exact same setup.
I don’t care what the market is doing…
Which stock is surging or tanking…
Or even what Trump’s latest announcement is.
None of it matters for this play.
And so far, this approach has delivered 70 separate cash payouts – 14 of them this year alone.
Now, I can’t guarantee any specific trade outcome…
But I can show you the entire game plan behind these weekly Friday payouts right here.
You’ll see:
- The recurring anomaly behind these Friday paydays…
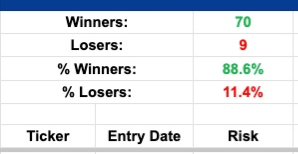
- How this strategy posted 70 different paydays with near 90% accuracy… &
- How you can follow along with the very next Friday payday opportunity.
If that sounds interesting to you…
Disclaimer: We develop tools and strategies to the best of our ability, but no one can guarantee the future. There is always a risk of loss when trading. Past performance is not indicative of future results. From 8/6/24 to 5/1/26, the average win rate on live published trade alerts is 88.6%. The average return (winners & losers) was 5.23% over a 3-day hold time.